- Table of Contents
- Introduction
- What is a Financial Statement?
- What is Financial Statement Analysis?
- Why is Financial Statement Analysis Important?
- 1. Informed Decision-Making
- 2. Performance Evaluation
- 3. Risk Assessment
- 4. Valuation
- 5. Regulatory Compliance
- 6. Strategic Planning
- 7. Benchmarking Against Competitors
- 8. Forecasting Future Performance
- Different Types of Financial Statement Analyses
- Horizontal Analysis
- Vertical Analysis
- Ratio Analysis
- How to Conduct a Financial Statement Analysis
- Step 1: Gather Financial Statements
- Step 2: Choose the Analysis Methodology
- Step 3: Perform the Analysis
- Step 4: Interpret the Results
- Step 5: Make Informed Decisions
- Financial Statement Analysis Example
- Income Statement (in thousands)
- Balance Sheet (in thousands)
- Cash Flow Statement (in thousands)
- Analysis
- Interpretation
- Conclusion
Introduction
Understanding the financial health of a business is crucial for investors, stakeholders, and management alike. Financial statements serve as the primary source of information for assessing a company's performance and making informed decisions. This blog post delves into the concept of financial statement analysis, exploring its significance, methodologies, and practical applications. By the end of this article, readers will have a thorough understanding of financial statements, the analysis techniques available, and how to apply these methods effectively.
What is a Financial Statement?
A financial statement is a formal record of the financial activities and position of a business, individual, or entity. These statements provide a summary of the financial performance over a specific period, offering insights into profitability, liquidity, and solvency. The primary types of financial statements include:
- Income Statement: Also known as the profit and loss statement, this document summarizes revenues, costs, and expenses over a specific period. It highlights the company’s ability to generate profit through its operations.
- Balance Sheet: This statement provides a snapshot of a company’s assets, liabilities, and equity at a particular point in time. It follows the fundamental accounting equation: Assets = Liabilities + Equity, showcasing what the company owns versus what it owes.
- Cash Flow Statement: This statement outlines the inflow and outflow of cash within a business over a specified period. It is divided into three sections: operating activities, investing activities, and financing activities, providing insights into the company’s liquidity and cash management.
- Statement of Changes in Equity: This statement details the movement in equity from the end of one fiscal period to the end of the next. It includes items such as retained earnings, dividends paid, and other comprehensive income, giving a clear view of how equity is affected by various transactions.
Each of these financial statements plays a vital role in providing a comprehensive view of a company’s financial health. Investors and analysts rely on these documents to evaluate performance, forecast future growth, and make investment decisions.

In any department, it’s important to have an overview and understanding of accounting procedures to remain within budget and make important financial decisions. Understanding how your finances can affect wider business performance and change is crucial to staying ahead of the market and remaining competitive.
What is Financial Statement Analysis?
Financial statement analysis refers to the process of examining and evaluating a company's financial statements to gain insights into its financial performance and position. This analysis helps stakeholders understand the trends, patterns, and relationships within the data, enabling them to make informed decisions.
The analysis can be performed using various techniques, including horizontal analysis, vertical analysis, andratio analysis. Each method offers unique perspectives and insights, allowing analysts to draw conclusions about the company's operational efficiency, profitability, and financial stability.

Preparation is critical when compiling business financial statements, as it lays the foundation for accurate, transparent, and insightful reporting. The process involves meticulously gathering, organising, and analysing financial data to create comprehensive statements that reflect a business's true financial health. Thorough
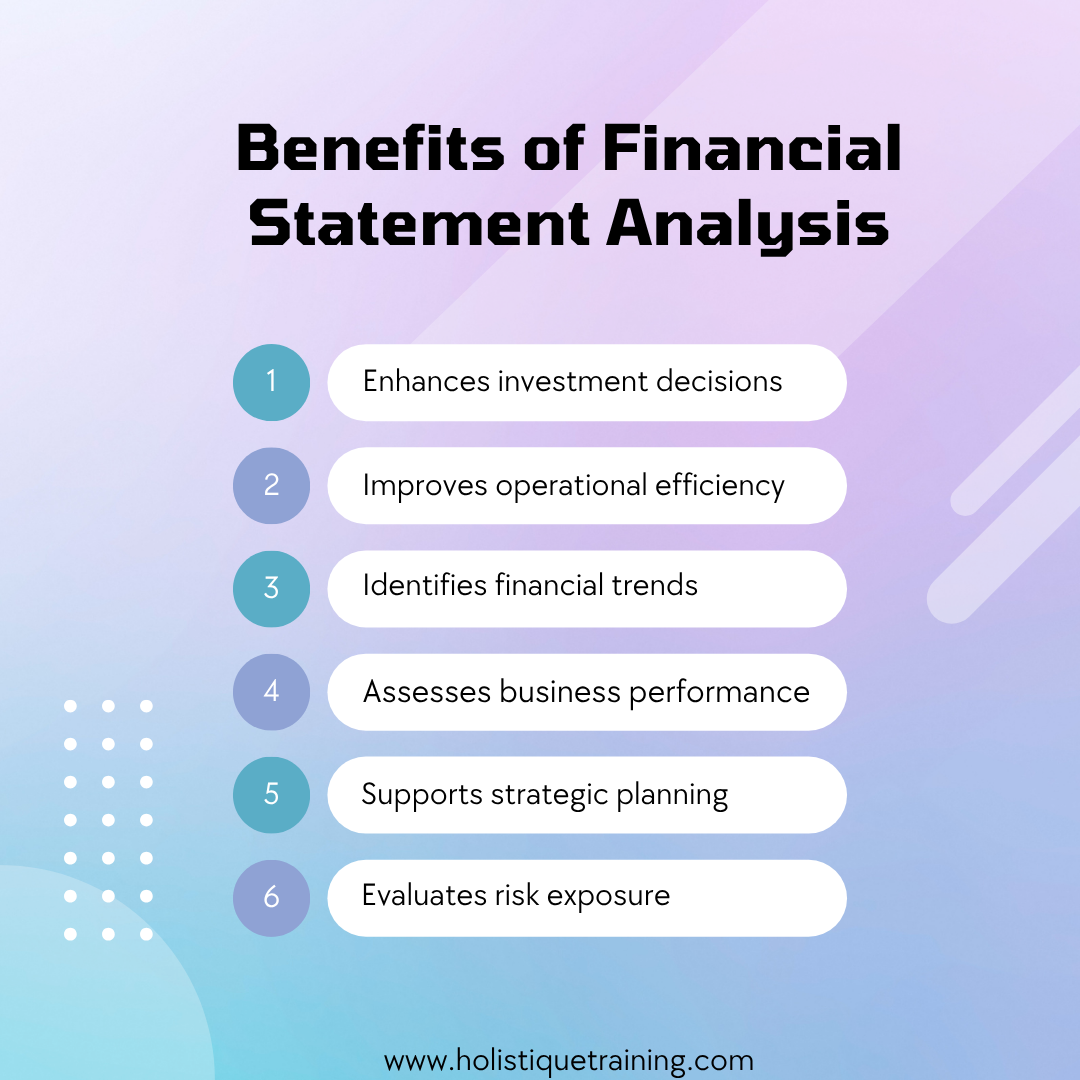
Why is Financial Statement Analysis Important?
The significance of financial statement analysis extends beyond mere number-crunching; it serves as a vital tool for understanding a company's overall health and guiding strategic decisions. Here are several key reasons that underscore its importance:
1. Informed Decision-Making
Financial statement analysis provides stakeholders—investors, management, creditors, and analysts—with the necessary data to make informed decisions. By evaluating a company's financial performance, stakeholders can assess whether to invest, lend, or adjust business strategies. For instance, an investor analyzing a company's income statement can determine if the firm has a consistent profit trend, which may influence their decision to buy or hold shares.
2. Performance Evaluation
For management, financial statement analysis is crucial for evaluating the effectiveness of business operations. By comparing current performance with historical data, management can identify strengths and weaknesses within the organization. This ongoing assessment allows for timely interventions, whether that means scaling back on underperforming divisions or investing more resources into profitable areas. By understanding these dynamics, companies can continuously improve their operational efficiency.
3. Risk Assessment
Investors and creditors utilize financial statement analysis to gauge the risk associated with a company. By examining liquidity ratios, debt levels, and cash flow statements, stakeholders can assess the likelihood of financial distress or bankruptcy. For example, a high debt-to-equity ratio may signal that a company is over-leveraged, making it a riskier investment. Understanding these risks enables stakeholders to make more prudent investment choices and manage their portfolios effectively.
4. Valuation
Determining the value of a company is a critical aspect of investment analysis, and financial statement analysis plays a central role in this process. By calculating various financial ratios and metrics, investors can establish a fair market value for a company's stock. For instance, usingprice-to-earnings (P/E) ratios allows investors to compare a company's valuation against its peers, helping them identify overvalued or undervalued stocks. This valuation process is essential for making sound investment decisions.
5. Regulatory Compliance
Companies are required to adhere to various accounting standards and regulations when preparing their financial statements. Financial statement analysis ensures compliance with these requirements, promoting transparency and accountability. For example, public companies must followGenerally Accepted Accounting Principles (GAAP) orInternational Financial Reporting Standards (IFRS). Regular analysis helps ensure that financial reporting is accurate and complies with legal standards, reducing the risk of penalties or reputational damage.

Microsoft Excel is a powerful tool for enhancing financial and business reporting processes. Its spreadsheet functionality lets users easily organise and analyse large economic data sets. It provides a structured platform for creating financial statements, such as income statements, balance sheets, and cash flow statements.
6. Strategic Planning
Management teams rely on financial statement analysis to develop effective strategic plans. By analyzing financial data, leaders can identify trends that inform resource allocation and operational adjustments. For example, if analysis reveals declining sales in a particular market segment, management may decide to pivot their marketing strategy or invest in product development to address the issue. This proactive approach to strategy formulation ensures that companies remain competitive and responsive to market changes.
7. Benchmarking Against Competitors
Financial statement analysis allows companies to benchmark their performance against competitors and industry standards. By comparing financial ratios and metrics, businesses can identify where they stand relative to their peers. This benchmarking process highlights areas for improvement and helps set realistic performance goals. For instance, if a company's gross profit margin is significantly lower than the industry average, it may indicate inefficiencies in production or pricing strategies that need to be addressed.
8. Forecasting Future Performance
Finally, financial statement analysis aids in forecasting future performance. By examining historical trends and financial patterns, stakeholders can make educated predictions about a company's future profitability and growth potential. For example, if a company has consistently increased its revenue by 10% annually, stakeholders might project similar growth rates for the upcoming years. This forecasting capability is invaluable for budgeting, strategic planning, and investment analysis.
In summary, the importance of financial statement analysis lies in its ability to provide comprehensive insights into a company's financial health, enabling stakeholders to make informed decisions, assess risks, and formulate effective strategies. By leveraging the information derived from financial statements, businesses can enhance their operational performance, ensure compliance, and ultimately drive long-term success.
Different Types of Financial Statement Analyses
Financial statement analysis can be conducted using several methodologies, each serving distinct purposes. The three primary types of analyses are:
Horizontal Analysis
Horizontal analysis involves comparing financial data over multiple periods. This technique allows stakeholders to identify trends and growth patterns by evaluating percentage changes in line items from one period to the next. For example, if a company's revenue increased from $1 million to $1.2 million over a year, the horizontal analysis would reveal a 20% growth.
Vertical Analysis
Vertical analysis, on the other hand, assesses financial statement items as a percentage of a base figure within the same period. For instance, in an income statement, each line item can be expressed as a percentage of total revenue. This method enables stakeholders to evaluate the relative size of each component and assess operational efficiency. For example, if a company has total sales of $500,000 and cost of goods sold (COGS) of $300,000, the COGS would represent 60% of total sales.
Ratio Analysis
Ratio analysis involves calculating various financial ratios to evaluate a company's performance and financial health. These ratios can be categorized into several groups:
- Liquidity Ratios: Measure a company's ability to meet short-term obligations. Common liquidity ratios include the current ratio (current assets/current liabilities) and quick ratio (liquid assets/current liabilities).
- Profitability Ratios: Assess a company's ability to generate profit relative to its revenue, assets, or equity. Key profitability ratios include net profit margin (net income/revenue) and return on equity (net income/shareholder’s equity).
- Leverage Ratios: Evaluate the extent to which a company is financing its operations through debt. Important leverage ratios include debt-to-equity ratio (total debt/total equity) and interest coverage ratio (EBIT/interest expense).
- Efficiency Ratios: Measure how effectively a company utilizes its assets to generate revenue. Common efficiency ratios include inventory turnover (COGS/average inventory) and asset turnover (revenue/average total assets).
Each of these analyses provides valuable insights into different aspects of a company's financial performance, enabling stakeholders to make well-informed decisions.
How to Conduct a Financial Statement Analysis
Conducting a financial statement analysis involves a systematic approach to evaluating a company's financial health and performance. This process requires careful examination of financial statements, selection of appropriate analytical methods, and interpretation of the results. Below are detailed steps to guide you through the financial statement analysis process:
Step 1: Gather Financial Statements
The first step in conducting a financial statement analysis is to collect the relevant financial documents. These typically include:
- Income Statement: This document summarizes revenues, expenses, and profits over a specific period, providing insights into the company's operational performance.
- Balance Sheet: This statement presents a snapshot of the company’s assets, liabilities, and equity at a particular point in time, reflecting its financial position.
- Cash Flow Statement: This statement outlines the inflows and outflows of cash from operating, investing, and financing activities, highlighting the company’s liquidity and cash management.
- Statement of Changes in Equity: This document shows the changes in equity accounts over a specific period, detailing factors like retained earnings, dividends, and stock issuances.
These documents can typically be found in the company’s annual report, quarterly filings, or financial databases. Ensuring you have the most recent and accurate statements is critical for a reliable analysis.
Step 2: Choose the Analysis Methodology
Once you have gathered the financial statements, the next step is to select the appropriate analysis methodology based on your objectives. The choice of methodology will depend on the specific insights you seek. Common methods include:
- Horizontal Analysis: Ideal for identifying trends over time by comparing financial data across multiple periods.
- Vertical Analysis: Useful for assessing the relative size of each line item within a single period, allowing for comparisons across companies of different sizes.
- Ratio Analysis: Best for evaluating specific aspects of financial performance, such as liquidity, profitability, leverage, and efficiency.
Selecting the right methodology will provide a focused framework for your analysis and help you draw meaningful conclusions.
Step 3: Perform the Analysis
This step involves executing the chosen analysis methods on the financial statements. Here’s how to approach each type of analysis:
Horizontal Analysis:
- Calculate the percentage change for key line items by comparing figures from different periods. For example, if revenue grew from $1 million to $1.2 million, you would determine the growth rate as(1,200,000-1,000,000)1,000,000100=20%
- Create a trend analysis table to visualize changes over multiple periods, making it easier to spot patterns.
Vertical Analysis:
- Convert each line item in the income statement and balance sheet into a percentage of a base figure. For instance, in the income statement, express each expense as a percentage of total revenue.
- Use these percentages to assess the composition of revenues and expenses, which can highlight areas of strength or concern in operational efficiency.
Ratio Analysis:
- Calculate key financial ratios using the relevant figures from the financial statements. For example, compute the current ratio asCurrent AssetsCurrent Liabilities to evaluate liquidity.
- Analyze profitability ratios like net profit marginNet IncomeRevenue100 to assess how effectively the company generates profit from sales.
Step 4: Interpret the Results
After performing the analysis, it’s crucial to interpret the results to draw meaningful conclusions. Consider the following:
- Identify Trends: Look for significant trends in revenue growth, expense management, and profitability. An increasing trend in revenue alongside stable expenses may indicate effective management and a growing market presence.
- Evaluate Ratios: Compare calculated ratios against industry benchmarks or historical performance. For example, if a company’s debt-to-equity ratio is significantly higher than the industry average, it may indicate higher financial risk.
- Contextualize Findings: Consider external factors that may impact the analysis, such as economic conditions, market trends, and industry developments. This context will help you understand the implications of the financial data more clearly.
Step 5: Make Informed Decisions
The final step in conducting a financial statement analysis is to use the insights gained to make informed decisions. This can involve:
- Investment Decisions: If the analysis indicates strong financial health and growth potential, it may lead to a decision to invest in the company’s stock. Conversely, if red flags are identified, it may prompt a reevaluation of investment strategies.
- Strategic Planning: For management, the insights from the analysis can inform strategic decisions such as resource allocation, cost management, and operational improvements. For instance, if the analysis reveals high operating expenses, management might explore cost-cutting measures or efficiency improvements.
- Risk Management: Understanding the financial risks highlighted in the analysis can guide decisions related to financing, capital structure, and operational strategies. For example, if liquidity ratios are concerning, management may prioritize improving cash flow or securing additional financing.
Conducting a financial statement analysis is a systematic process that equips stakeholders with the knowledge needed to evaluate a company's financial performance and make informed decisions. By gathering relevant financial statements, selecting appropriate analysis methodologies, performing the analysis, interpreting the results, and applying the insights, stakeholders can gain a comprehensive understanding of a company's financial health. This process is essential for investors, management, and analysts alike, as it provides the foundation for sound financial decision-making and strategic planning.
Financial Statement Analysis Example
To illustrate the process of financial statement analysis, let’s consider a hypothetical company, ABC Corp., and its financial statements for the past two years.
Income Statement (in thousands)
Item | Year 1 | Year 2 |
Revenue | 1,000 | 1,200 |
Cost of Goods Sold (COGS) | 600 | 720 |
Gross Profit | 400 | 480 |
Operating Expenses | 200 | 240 |
Net Income | 200 | 240 |
Balance Sheet (in thousands)
Item | Year 1 | Year 2 |
Total Assets | 1,500 | 1,800 |
Total Liabilities | 700 | 900 |
Shareholder’s Equity | 800 | 900 |
Cash Flow Statement (in thousands)
Item | Year 1 | Year 2 |
Cash from Operating Activities | 300 | 800 |
Cash from Investing Activities | (100) | (120) |
Cash from Financing Activities | (50) | (60) |
Net Cash Flow | 150 | 180 |
Analysis
Horizontal Analysis:
- Revenue increased from $1,000,000 to $1,200,000, a growth of 20%.
- Net income increased from $200,000 to $240,000, a growth of 20%.
Vertical Analysis (Year 2):
COGS as a percentage of revenue:
7201,200100=60%
Operating expenses as a percentage of revenue:
2401,200100=20%
Ratio Analysis:
Current Ratio (assuming current assets of $800,000 and current liabilities of $400,000):800400=2.0
Net Profit Margin:2401,200100=20%
Interpretation
ABC Corp. shows solid growth in revenue and net income, maintaining a stable net profit margin of 20%. The current ratio of 2.0 indicates a strong liquidity position, suggesting the company can meet its short-term obligations comfortably. However, the increase in COGS to 60% of revenue indicates that cost management may need attention to maintain profitability.
Conclusion
Financial statement analysis is an essential tool for understanding a company’s financial health and performance. By examining financial statements using various methodologies such as horizontal, vertical, and ratio analysis, stakeholders can gain valuable insights that inform decision-making and strategic planning. This analytical process not only aids investors in evaluating potential investments but also helps management in assessing operational efficiency and identifying areas for improvement. As the financial landscape continues to evolve, the importance of conducting thorough financial statement analysis remains paramount for anyone engaged in the world of finance and investment.
In summary, mastering financial statement analysis equips stakeholders with the knowledge and tools necessary to navigate the complexities of financial data, ultimately leading to more informed and strategic decisions. For those looking to deepen their understanding of financial principles and enhance their analytical skills, our MBA in Accounting and Finance offers comprehensive coursework that covers financial statement analysis in depth. This program is designed to empower professionals with the expertise needed to excel in the finance industry, providing practical insights and advanced tools that can be applied in real-world scenarios. Enroll today to take the next step in your financial career!

Having accurate and efficient accounting and finance processes, employees, and systems are essential to any business. Without good record upkeep, policies designed to keep track of spending and overheads, and competent employees who are prepared to identify issues and risk areas, your business could fall