Introduction
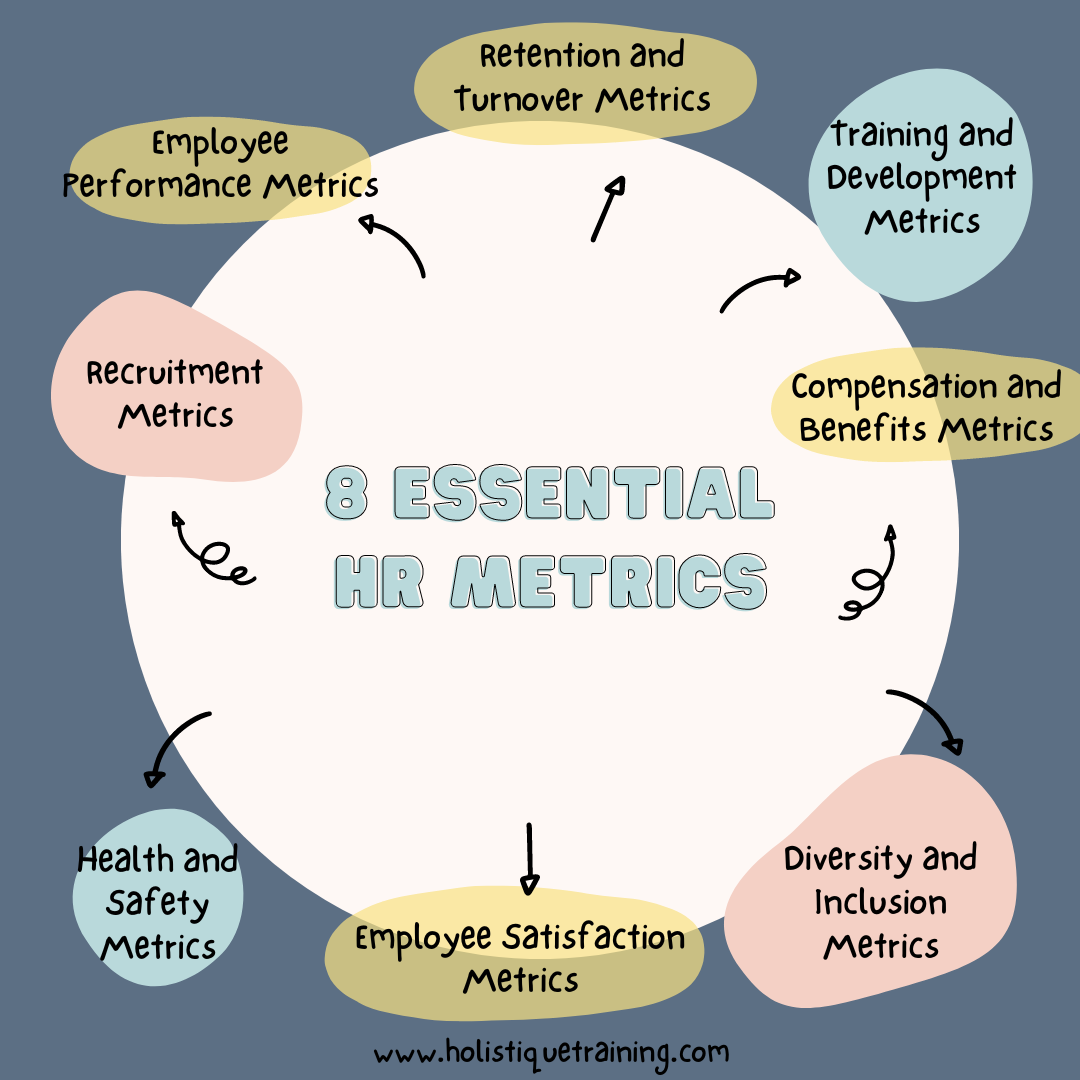
In 2024, HR departments are increasingly turning to data-driven insights to optimize their operations and improve employee experiences. This article explores the "8 Essential HR Metrics in 2024," covering key areas such as Recruitment, Employee Performance, Retention and Turnover, Training and Development, Compensation and Benefits, Diversity and Inclusion, Employee Satisfaction, and Health and Safety. These metrics are crucial for HR professionals aiming to enhance strategic decision-making and foster a supportive, productive workplace culture.
Recruitment Metrics
Recruitment metrics are key performance indicators (KPIs) that HR teams use to measure and analyze the effectiveness of their hiring processes. These metrics help organizations assess how well they are attracting, hiring, and retaining talent. Understanding and optimizing recruitment metrics can lead to more efficient hiring processes, better quality of hires, and improved alignment of recruitment strategies with business goals. Here are some of the most important recruitment metrics:
- Time to Fill: This measures the amount of time it takes to find and hire a candidate for a specific position, from the day the job requisition is opened until the day an offer is accepted. It helps organizations understand the efficiency of their recruitment processes.
- Time to Hire: Similar to time to fill, but specifically measures the time from when a candidate enters the recruitment process (e.g., applies or is sourced) to when they accept the job offer. This metric focuses on the effectiveness and speed of the recruitment team after candidates have been identified.
- Cost per Hire: This calculates the total costs involved in hiring a new employee. Costs include advertising fees, recruiter salaries, job fair expenses, and other recruitment-related expenses. It helps in budgeting and evaluating the cost-effectiveness of the recruitment process.
- Quality of Hire: This metric assesses the value new hires bring to the company. It can be measured by the performance and productivity of new employees, their impact on team performance, and retention rates during a set period.
- Candidate Experience: Evaluates how candidates feel about the organization’s hiring process. A positive candidate experience can enhance an organization's reputation and attract top talent.
- Source of Hire: Tracks which recruiting channels (e.g., job boards, social media, referrals) are most effective at bringing in successful candidates. This helps in optimizing recruitment strategies and resource allocation.
- Offer Acceptance Rate: Measures the percentage of job offers that are accepted by candidates. A lower rate might indicate issues with the competitiveness of the offer, the employer's brand, or the recruitment process itself.
- Applicant Drop-off Rate: This metric looks at the percentage of candidates who start but do not complete the application process. High rates may indicate problems with the application process or candidate disinterest at some stage.
These metrics provide crucial insights that can help HR professionals streamline their recruitment processes, improve candidate quality, reduce costs, and ultimately enhance the overall strategic contribution of the recruitment function to the organization.
Employee Performance Metrics
Employee Performance Metrics are quantifiable measures used to evaluate the work performance of employees within an organization. These metrics are crucial for assessing productivity, effectiveness, and efficiency of staff, and they play a key role in performance management, decision-making, and strategic planning. Here are some key Employee Performance Metrics:
- Productivity Metrics: These assess the amount of work an employee completes in a given period. Common examples include sales volume, number of customer support tickets resolved, units produced, or any other output relevant to the employee's role.
- Quality of Work: This measures the standard of work performed by an employee. It might be evaluated through error rates, customer satisfaction scores, or peer/review feedback depending on the job.
- Employee Efficiency: This evaluates how quickly and effectively employees complete tasks without compromising quality. Efficiency can be especially important in roles where output can be clearly measured, such as manufacturing or data entry.
- Goal Achievement: Measures how well employees meet predetermined objectives or milestones. These can be quantitative (such as sales targets) or qualitative (such as completing a project phase).
- Employee Engagement: While indirectly related to performance, engaged employees often show higher productivity and quality of work. Engagement can be measured through surveys that assess employee feelings about their jobs, colleagues, and the organization.
- 360-Degree Feedback: This involves collecting performance data from all individuals who interact with the employee, including managers, peers, subordinates, and sometimes clients. It provides a comprehensive view of an employee's performance and behavior.
- Absence Rates: Tracks the frequency and duration of employee absences. High absence rates can indicate poor job satisfaction or engagement, potentially affecting overall productivity.
- Rate of Improvement: Measures how an employee’s performance has progressed over time, focusing on areas of development and growth. This is particularly useful for performance appraisals and developmental programs.
- Innovation and Initiative: Assesses an employee's ability to bring new ideas and take proactive steps towards problem-solving and improving processes.

Process innovation is crucial to a business's survival. To keep up with market trends, common practices, and industry standards, an organisation needs to have a strong focus on innovation. Without it, it is bound to quickly fall behind and be drowned out by more efficient
- Compliance with Standards: In certain industries, particularly those that are heavily regulated, compliance metrics are critical and assess whether employees are adhering to required standards and procedures.
These metrics not only help in evaluating individual employee performance but also contribute to a deeper understanding of the collective workforce's effectiveness. This understanding can inform training needs, adjustments in work processes, and strategic decisions to improve overall organizational performance.
Retention and Turnover Metrics
Retention and turnover metrics are critical indicators that help organizations assess their ability to maintain a stable workforce and understand the reasons behind employee departures. These metrics are vital for HR professionals as they reflect the company's work environment, culture, compensation, and overall employee satisfaction. Here are some of the key retention and turnover metrics:
- Employee Turnover Rate: This is the percentage of employees who leave the company within a certain period, usually calculated annually. It is divided into voluntary turnover (employees who leave by choice) and involuntary turnover (employees who are terminated or laid off).
- Retention Rate: The opposite of turnover rate, this metric measures the percentage of employees who stay with the organization over a given period. High retention rates are typically indicative of a positive working environment and effective management practices.
- Average Tenure: This metric calculates the average length of time employees stay with the company. Longer tenures can indicate job satisfaction and effective retention strategies.
- Cost of Employee Turnover: Measures the cost associated with replacing an employee, including recruitment, training, and the lost productivity during this time. It helps organizations understand the financial impact of turnover.
- Turnover Rate by Department or Role: Breaking down turnover rates by department or role can highlight specific areas or positions with higher turnover issues, suggesting where improvements may be needed.
- Reasons for Leaving: Analyzing why employees leave (through exit interviews or surveys) provides insights into potential issues within the company that may need addressing to improve retention.
- Engagement Levels: While more of a preventative measure, monitoring employee engagement can help predict turnover. Disengaged employees are more likely to leave, so this metric can serve as an early warning system.
- Promotion Rate: The rate at which employees are promoted can also affect retention, as it reflects career development opportunities within the company. Lack of promotion opportunities can lead to higher turnover.
- Employee Satisfaction Index: Often derived from regular surveys, this index measures how satisfied employees are with various aspects of their job and the company. It can be a good indicator of potential retention challenges.
- Hiring Manager Satisfaction: This metric assesses how satisfied managers are with the employees they manage. Dissatisfaction can be a sign of poor hiring matches or management issues, which could eventually impact turnover.
These retention and turnover metrics help organizations identify problems and opportunities within their HR practices, fostering a more supportive and engaging work environment to maintain a stable and committed workforce.
Training and Development Metrics
Training and Development Metrics are crucial for evaluating the effectiveness and impact of training programs within an organization. These metrics help HR and training departments assess whether their initiatives are successful in enhancing employee skills, knowledge, and performance. Here are some key metrics used to measure training and development:
- Training Completion Rate: Measures the percentage of employees who complete assigned training programs within a specified period. This metric helps organizations gauge employee commitment and the accessibility or appropriateness of the training provided.
- Post-Training Assessment Scores: Evaluates the knowledge or skills of employees before and after training through tests or assessments. Improvement in scores indicates the effectiveness of the training content.
- Return on Investment (ROI): Calculates the financial return on investment for training activities.ROI is determined by comparing the cost of training (including development, delivery, and time spent by employees) against the benefits realized, such as increased productivity or reduced operational costs.
- Employee Satisfaction with Training: Gauges how employees perceive the training they receive. Satisfaction can be measured through surveys or feedback forms post-training, assessing aspects like content relevance, trainer effectiveness, and overall training experience.
- Behavior Change: Observes changes in work behavior or practices following training. This metric is particularly important for training aimed at improving safety, compliance, or operational procedures.

Change management protocols within an HR department are crucial for ensuring smooth transitions during organisational changes. These protocols establish systematic approaches to anticipate, plan, and implement changes effectively, minimising disruptions and maximising employee engagement and productivity. By implementing change management
- Training Application Rate: Measures how frequently employees apply the skills or knowledge gained from training in their daily work. This can be assessed through direct observation, self-reporting, or feedback from supervisors.
- Skill Advancement: Assesses the enhancement of skills due to training programs. This can be measured by skill assessments conducted periodically after the training has been completed.
- Training Cost Per Employee: Calculates the total cost of training divided by the number of employees trained. This metric helps organizations track and manage the cost-effectiveness of their training initiatives.
- Time to Proficiency: Measures the time it takes for employees to become proficient in their roles after undergoing training. A shorter time to proficiency indicates more effective training.
- Employee Retention Post-Training: Tracks retention rates of employees who have undergone training versus those who have not. Higher retention among trained employees can indicate the value and effectiveness of training programs in fostering employee loyalty and satisfaction.
By monitoring these metrics, organizations can refine their training programs to better align with business goals, enhance employee performance, and ensure a high return on investment in employee development.

Many forward-thinking business owners realise that simply giving orders isn't the most effective way to get work done. Research shows that employees are more motivated and productive when they are free to make their own choices and follow paths they enjoy.
Compensation and Benefits Metrics
Compensation and Benefits Metrics are crucial for organizations to ensure that their compensation packages remain competitive, equitable, and aligned with their strategic objectives. These metrics help HR departments manage employee compensation and benefits effectively, influencing employee satisfaction, retention, and overall organizational performance. Here are some key metrics used to analyze compensation and benefits:
- Compensation Competitiveness: This metric compares an organization’s pay scales for various positions against market rates or industry benchmarks. It helps ensure that the organization remains competitive in attracting and retaining talent.
- Pay Equity: Measures disparities in compensation among employees based on gender, ethnicity, or other demographic factors. This metric is crucial for ensuring fairness and compliance with equal pay regulations.
- Benefits Utilization Rate: Tracks the percentage of employees utilizing specific benefits offered by the company, such as health insurance, retirement plans, or wellness programs. High utilization rates can indicate that the benefits are valued by employees, whereas low rates may suggest a need for reevaluation or better communication about available benefits.
- Cost Per Employee: Calculates the total cost of compensation and benefits per employee. This includes salaries, bonuses, benefits, and any other employee-related expenses. This metric helps in budgeting and monitoring cost efficiency.
- Benefits Satisfaction: Assesses how satisfied employees are with the benefits package. This is usually measured through employee surveys and can influence decisions on modifying benefits offerings.
- Total Compensation Ratio: Compares the total compensation of individual roles or levels within the organization to ensure internal equity. It helps identify discrepancies that might affect employee morale or cause turnover.
- Salary Compression: Measures the degree to which there is a smaller than desired difference in pay between employees regardless of their skills, experience, or job responsibilities. It can highlight issues in pay structures that may demotivate employees or hinder recruitment.
- Bonus and Incentives Effectiveness: Evaluates the impact of bonuses and incentive programs on achieving business goals and motivating employees. Effectiveness can be gauged by examining goal attainment levels post-incentive implementation.
- Return on Compensation Investment: Similar to ROI in other areas, this metric assesses the effectiveness of the compensation strategy in terms of productivity, employee satisfaction, and retention rates relative to the costs incurred.
- Labor Cost as a Percentage of Revenue: Measures total labor costs (including salaries, benefits, and other employee-related expenses) as a percentage of the company’s revenue. This metric helps assess how labor costs are impacting the company’s profitability.
Table 1: Key Compensation and Benefits Metrics
Metric Name | Description |
Compensation Competitiveness | Compares an organization’s pay scales for various positions against market rates or industry benchmarks, ensuring competitiveness in attracting and retaining talent. |
Pay Equity | Measures disparities in compensation among employees based on gender, ethnicity, or other demographic factors, ensuring fairness and compliance with equal pay regulations. |
Benefits Utilization Rate | Tracks the percentage of employees utilizing specific benefits, such as health insurance, retirement plans, or wellness programs, indicating the value of these benefits. |
Cost Per Employee | Calculates the total cost of compensation and benefits per employee, aiding in budgeting and monitoring cost efficiency. |
Benefits Satisfaction | Assessed usually through surveys, this metric evaluates how satisfied employees are with the benefits package, influencing potential benefits adjustments. |
Total Compensation Ratio | Compares the total compensation of individual roles or levels within the organization to ensure internal equity and identify potential pay discrepancies. |
Salary Compression | Measures the degree of minimal pay differences among employees despite differences in skills or experience, highlighting potential issues in pay structures. |
Bonus and Incentives Effectiveness | Evaluates the impact of bonuses and incentive programs on achieving business goals and motivating employees, measured by goal attainment levels. |
Return on Compensation Investment | Assesses the effectiveness of the compensation strategy in terms of productivity, employee satisfaction, and retention rates relative to the costs incurred. |
Labor Cost as a Percentage of Revenue | Measures total labor costs (including salaries, benefits, and other expenses) as a percentage of the company’s revenue, assessing the impact of labor costs on profitability. |
These metrics provide valuable insights into how well the compensation and benefits strategies are performing and guide adjustments to better meet the needs of both the organization and its employees.
Diversity and Inclusion Metrics
Diversity and Inclusion (D&I) Metrics are essential for organizations to measure and evaluate the effectiveness of their diversity initiatives and the inclusiveness of their workplace culture. These metrics help businesses ensure that they are fostering an environment where diverse talent is welcomed, valued, and given equal opportunities to succeed. Here are some key D&I metrics that organizations commonly use:
- Diversity Representation: Measures the demographic makeup of the workforce, including the distribution of employees across different groups based on race, gender, age, disability, veteran status, and other relevant categories. This metric helps organizations understand the level of diversity within their teams.
- Inclusion Index: Often derived from employee surveys, this index assesses employees' perceptions of inclusivity at their workplace. Questions might cover topics like respect, fairness, belonging, and voice. A high inclusion index indicates a more inclusive workplace environment.
- Hiring Diversity: Tracks diversity metrics within the hiring process to ensure that recruitment practices are attracting a diverse pool of candidates. This metric can highlight potential biases in sourcing, screening, or interviewing processes.
- Promotion Rates by Demographics: Analyzes promotion rates across different demographic groups to identify any disparities in career advancement opportunities. Equitable promotion rates suggest effective inclusion practices.
- Retention Rates by Demographics: Examines the turnover rates within different demographic groups. Disparities in retention can indicate issues in workplace culture that might affect certain groups more than others.
- Employee Resource Groups (ERGs): Measures the participation and impact ofERGs, which are employee-led groups that foster a diverse, inclusive workplace aligned with organizational missions, values, and goals. The effectiveness of ERGs can be a strong indicator of the inclusiveness of the organization.
- D&I Training Completion Rates: Monitors the completion rates of diversity and inclusion training programs. High completion rates generally reflect a workforce that is engaged in learning about and contributing to D&I efforts.
- Pay Equity: Assesses compensation fairness across different demographic groups. This metric is crucial for ensuring that all employees are paid equitably for similar roles and performance levels, regardless of their demographic characteristics.
- D&I Goals Achievement: Tracks progress against set diversity and inclusion goals, such as improving diversity in leadership positions or increasing overall workforce diversity.
- Supplier Diversity: Measures the percentage of spending with suppliers owned by underrepresented groups. This metric extends the commitment to diversity beyond the organization's internal practices to its broader business relationships.
Monitoring these metrics allows organizations to identify areas where their D&I efforts may be lacking and provides data-driven insights to improve policies and practices, thereby fostering a more diverse and inclusive workplace.
Employee Satisfaction Metrics
Employee Satisfaction Metrics are crucial indicators that help organizations gauge the contentment and happiness of their employees with various aspects of their job and workplace environment. These metrics are essential for understanding employee morale, which directly impacts productivity, retention, and overall company performance. Here’s a look at key metrics used to measure employee satisfaction:
- Employee Satisfaction Survey Scores: Surveys are the primary tool for measuring employee satisfaction. They can cover a wide range of topics such as job satisfaction, relationships with managers and peers, workplace environment, and alignment with the company’s mission and values.
- Net Promoter Score (NPS) for Employee Experience: Adapted from customer service evaluations, this score measures how likely employees are to recommend their workplace to friends and family. A highNPS indicates a positive employee experience, while a low NPS suggests areas for improvement.
- Employee Engagement Index: This composite metric can be derived from survey data and assesses the level of engagement and enthusiasm employees feel towards their work and the company. It reflects how emotionally and intellectually committed employees are to their roles and the organization.
- Turnover Rate: While primarily a turnover metric, a high turnover rate can also indicate low job satisfaction if many employees leave voluntarily. Monitoring turnover can help identify dissatisfaction trends.
- Absence Rates: Frequent unexplained absences might indicate low job satisfaction, as dissatisfied employees may be less motivated to attend work regularly.
- Job Satisfaction Levels Over Time: Tracking changes in job satisfaction over time can help HR identify trends and determine whether changes in policies or the work environment are affecting employee morale.
- Retention Rates of Top Performers: High retention rates among top performers can indicate higher job satisfaction within this group, as these employees often have more opportunities elsewhere but choose to stay.
- Exit Interview Feedback: Feedback from departing employees can provide valuable insights into satisfaction levels and reasons for dissatisfaction. Regular analysis of this feedback can help identify common issues that need addressing.
- Work-Life Balance Metrics: Measures how satisfied employees are with their ability to balance work responsibilities with personal life. Surveys may ask about the adequacy of time off, flexibility of schedules, and support from management for personal needs.
- Recognition and Rewards Feedback: Employee perceptions of the fairness and effectiveness of the recognition and rewards systems can significantly impact satisfaction. This includes feedback on both formal programs and day-to-day recognition practices.
These metrics provide valuable insights that can guide organizations in creating a more satisfying and motivating work environment. By regularly monitoring these indicators, companies can proactively manage employee morale, which in turn helps in retaining talent and enhancing organizational productivity.
Health and Safety Metrics
Health and Safety Metrics are crucial for ensuring that workplace environments are safe and healthy for employees. These metrics help organizations monitor the effectiveness of their health and safety programs, comply with regulations, and prevent workplace accidents and illnesses. Here are key metrics commonly used to measure health and safety performance:
- Total Recordable Incident Rate (TRIR): This metric tracks the number of recordable safety incidents per 100 full-time employees during a given time period. It provides a broad indicator of the overall safety performance and helps organizations identify trends in workplace incidents.
- Lost Time Injury Frequency Rate (LTIFR): Measures the number of lost time injuries (injuries that result in time away from work) per million hours worked. It highlights the severity of accidents and the impact on workforce productivity.
- Near Miss Frequency Rate: Tracks the number of near miss incidents—situations where an incident could have occurred but did not—per a set number of hours worked. Monitoring near misses can help prevent actual accidents by identifying and mitigating risks before they lead to injuries.
- Severity Rate: Calculates the number of lost work days per 100 hours worked due to injuries. This metric gives insight into the severity of accidents occurring in the workplace.
- Worker’s Compensation Claims: Counts the number of claims filed for worker’s compensation due to workplace injuries or illnesses. This metric can indicate the overall cost impact of safety issues on the organization.
- Days Away, Restricted, or Transferred (DART) Rate: Measures the number of injuries per 100 employees that result in days away from work, job restrictions, or job transfers. This metric helps assess the impact of injuries on work capacity and productivity.
- Occupational Illness Rate: Tracks the incidence of work-related illnesses per 100 full-time employees. This metric is essential for monitoring health outcomes related to workplace conditions, such as exposure to hazardous substances.
- Health and Safety Training Completion Rate: Measures the percentage of employees who have completed mandatory health and safety training. This metric assesses the organization's commitment to educating its workforce about safety practices.
- Employee Perception of Safety: Gauged through surveys, this metric assesses how safe employees feel in their workplace. Employee perception can be a leading indicator of potential safety issues not yet captured through other metrics.
- Emergency Response Time: Measures the time it takes for emergency response teams to react to a safety incident. Faster response times can reduce the severity of injuries and improve outcomes.
Table 2: Key Health and Safety Metrics
Metric Name | Description |
Total Recordable Incident Rate (TRIR) | Tracks the number of recordable safety incidents per 100 full-time employees during a given time period. |
Lost Time Injury Frequency Rate (LTIFR) | Measures the number of lost time injuries per million hours worked, highlighting the severity of accidents. |
Near Miss Frequency Rate | Tracks the number of near miss incidents per a set number of hours worked to help identify and mitigate risks. |
Severity Rate | Calculates the number of lost work days per 100 hours worked due to injuries, providing insight into accident severity. |
Worker’s Compensation Claims | Counts the number of claims filed for worker’s compensation due to workplace injuries or illnesses. |
Days Away, Restricted, or Transferred (DART) Rate | Measures the number of injuries per 100 employees that result in days away from work, restrictions, or transfers. |
Occupational Illness Rate | Tracks the incidence of work-related illnesses per 100 full-time employees, crucial for monitoring health outcomes. |
Health and Safety Training Completion Rate | Measures the percentage of employees who have completed mandatory health and safety training. |
Employee Perception of Safety | Assessed through surveys, this metric gauges how safe employees feel in their workplace. |
Emergency Response Time | Measures the time it takes for emergency response teams to react to a safety incident, aiming to reduce injury severity. |
These metrics are critical not only for maintaining compliance with health and safety regulations but also for fostering a culture of safety within the organization. Regular monitoring and analysis of these indicators help organizations identify risk areas, improve safety protocols, and ultimately ensure a safer workplace for all employees.
Conclusion
In conclusion, mastering these 8 essential HR metrics in 2024 is crucial for any organization striving to optimize its human resource functions. By effectively tracking and analyzing these key areas, HR professionals can make informed decisions that not only improve operational efficiencies but also contribute to a more engaged and satisfied workforce. Embracing these metrics will equip HR teams to navigate the complexities of the modern workplace and drive their organizations towards sustained success.

In this training course, you will discover how to accurately track analytical people data and process strategic decisions to build successful business models and work towards improving company practices. You will uncover how HR data is used to demonstrate an