
- Table of Contents
- Introduction
- What Is a Quality Tool?
- Origins of Quality Tools
- Importance of Quality Tools
- Precision in Problem-Solving
- Data-Driven Decision-Making
- Cultivating a Culture of Continuous Improvement
- Enhancing Customer Satisfaction
- Optimising Resources and Efficiency
- Upholding Standards and Compliance
- Driving Innovation and Adaptation
- The 11 Quality Tools
- 1. Cause and Effect Diagram (Fishbone Diagram)
- 2. Pareto Chart
- 3. Histogram
- 4. Control Chart
- 5. Scatter Diagram
- 6. Flow Chart
- 7. Check Sheet
- 8. Stratification
- 9. The 5 Whys
- 10. Affinity Diagram
- 11. SIPOC Diagram
- Scenario: Implementing a New Customer Service Process
- Quality Management and the Role of Quality Tools
- Enhancing Process Understanding and Optimisation
- Facilitating Data-Driven Decision-Making
- Driving Continuous Improvement Initiatives
- Promoting Stakeholder Engagement and Collaboration
- Supporting Compliance and Risk Management
- Driving Customer-Centric Quality Initiatives
- Tips for Using the Right Tools for Your Career
- 1. Understand the Problem Contextually
- 2. Choose Appropriate Tools Based on Data Availability
- 3. Master the Techniques
- 4. Collaborate and Seek Diverse Perspectives
- 5. Measure and Monitor Impact
- 6. Communicate Effectively
- 7. Embrace Lifelong Learning and Adaptation
- Conclusion
Introduction
Quality tools are indispensable assets in pursuing excellence and efficiency across various industries. They provide structured approaches to identify, analyse, and solve quality-related issues, ultimately enhancing productivity and customer satisfaction. Originating from the pioneering work of quality management experts like W. Edwards Deming and Joseph M. Juran, these tools have evolved into a comprehensive set known as the 11 Quality Tools. Understanding and mastering these tools can significantly bolster your career by enabling you to drive continuous improvement and ensure superior outcomes in your professional endeavours.
What Is a Quality Tool?
A quality tool is a technique or instrument professionals use to analyse and improve processes, products, or services. These tools facilitate data collection, analysis, and decision-making, aiming to eliminate defects, minimise variability, and enhance overall quality. They provide systematic approaches to problem-solving, helping organisations achieve consistency and excellence in their operations.
Origins of Quality Tools
The concept of quality tools emerged during the mid-20th century as part of the broader quality management movement. W. Edwards Deming and Joseph M. Juran, among others, pioneered developing and applying these tools in industries such as manufacturing, healthcare, and service sectors. Their work emphasised statistical methods and systematic approaches to quality improvement, laying the foundation for modern quality management practices worldwide.
Importance of Quality Tools
Quality tools serve as fundamental assets in the pursuit of excellence across diverse industries, offering structured methodologies to enhance processes, products, and services. Their significance extends beyond mere problem-solving; they are integral to fostering a culture of continuous improvement, driving organisational success, and bolstering individual career development.
Precision in Problem-Solving
Quality tools' core lies their ability to pinpoint and address the root causes of issues. By employing tools such as the Cause and Effect Diagram (Fishbone Diagram) or the 5 Whys technique, professionals can systematically unravel complex problems. These tools facilitate a structured approach to problem-solving, ensuring that efforts are focused on addressing underlying issues rather than symptoms. This precision resolves immediate challenges and prevents recurrence, thereby improving efficiency and productivity.
Data-Driven Decision-Making
In today's data-rich environment, informed decisions are paramount. Quality tools enable professionals to collect, analyse, and interpret data effectively. For instance, Histograms and Pareto Charts offer visual representations that highlight data trends, patterns, and outliers, empowering decision-makers to prioritise actions based on factual insights. By basing decisions on empirical evidence rather than intuition, organisations can mitigate risks, optimise resources, and capitalise on growth opportunities.
Cultivating a Culture of Continuous Improvement
Quality tools are catalysts for fostering a culture of continuous improvement within organisations. Tools like Control Charts and Scatter Diagrams provide mechanisms to monitor processes, detect variations, and identify areas for enhancement. Organisations encourage innovation, collaboration, and shared accountability for quality outcomes by engaging teams in the systematic application of these tools. This proactive approach enhances operational efficiency and nurtures a dynamic work environment where learning and adaptation are embraced as cornerstones of success.
Enhancing Customer Satisfaction
Customer expectations are increasingly demanding, necessitating an uncompromising commitment to quality. Quality tools are pivotal in meeting these expectations by improving product or service reliability, consistency, and functionality. Tools such as Check Sheets and Stratification allow organisations to gather customer feedback systematically, analyse preferences, and tailor offerings to meet evolving needs. By prioritising customer-centric quality initiatives, organisations cultivate loyalty, advocacy, and sustainable growth in competitive markets.
Optimising Resources and Efficiency
Efficiency is the hallmark of competitive advantage in today's global economy. Quality tools enable organisations to streamline processes, eliminate waste, and optimise resource allocation. Flow Charts and SIPOC Diagrams provide visual representations that enhance understanding of process workflows, dependencies, and bottlenecks. This clarity empowers teams to identify opportunities for efficiency gains, redesign workflows, and implement measures that enhance productivity and cost-effectiveness. By leveraging these tools, organisations achieve operational excellence and strengthen their market position through superior value propositions.
Upholding Standards and Compliance
Adherence to industry standards and regulatory requirements is non-negotiable in many sectors. Quality tools facilitate compliance by providing frameworks for documenting processes, tracking performance metrics, and conducting audits. Tools like Affinity Diagrams and Cause and Effect Diagrams aid in root cause analysis and risk mitigation, ensuring that organisations proactively address compliance challenges. By embedding quality tools into governance frameworks, organisations uphold integrity, mitigate legal risks, and sustain market reputational credibility.

If your company produces goods or sells a service to the public, you can’t afford not to be quality-compliant. The quality of your products or service offering ultimately creates trust in your brand, increases your customer retention, and provides excellent customer satisfaction results, which can
Driving Innovation and Adaptation
Innovation is the lifeblood of organisational resilience and growth. Quality tools stimulate innovation by encouraging experimentation, collaboration, and cross-functional problem-solving. Tools such as Scatter Diagrams and Affinity Diagrams facilitate interdisciplinary dialogue, enabling diverse teams to explore novel solutions and anticipate market trends. By embracing a culture where quality tools are leveraged to drive innovation, organisations enhance agility, responsiveness, and the ability to capitalise on emerging opportunities in dynamic business environments.
In short, the importance of quality tools in career development cannot be overstated. Beyond their technical utility in problem-solving and decision-making, these tools embody principles of continuous improvement, customer-centricity, and operational excellence. By mastering and integrating quality tools into daily practice, professionals not only enhance their individual capabilities but also contribute significantly to organisational success and industry leadership. Embrace quality tools as instruments of empowerment and transformation, guiding your journey towards sustained professional growth, impactful contributions, and enduring success in the competitive landscape of contemporary industries.
The 11 Quality Tools
Quality tools constitute a comprehensive arsenal of techniques designed to facilitate systematic problem-solving, data analysis, and process improvement across diverse industries. Each tool serves a distinct purpose in identifying, understanding, and resolving challenges, contributing to enhanced efficiency, quality, and customer satisfaction. Mastery of these tools empowers professionals to drive continuous improvement and achieve superior outcomes in their careers.
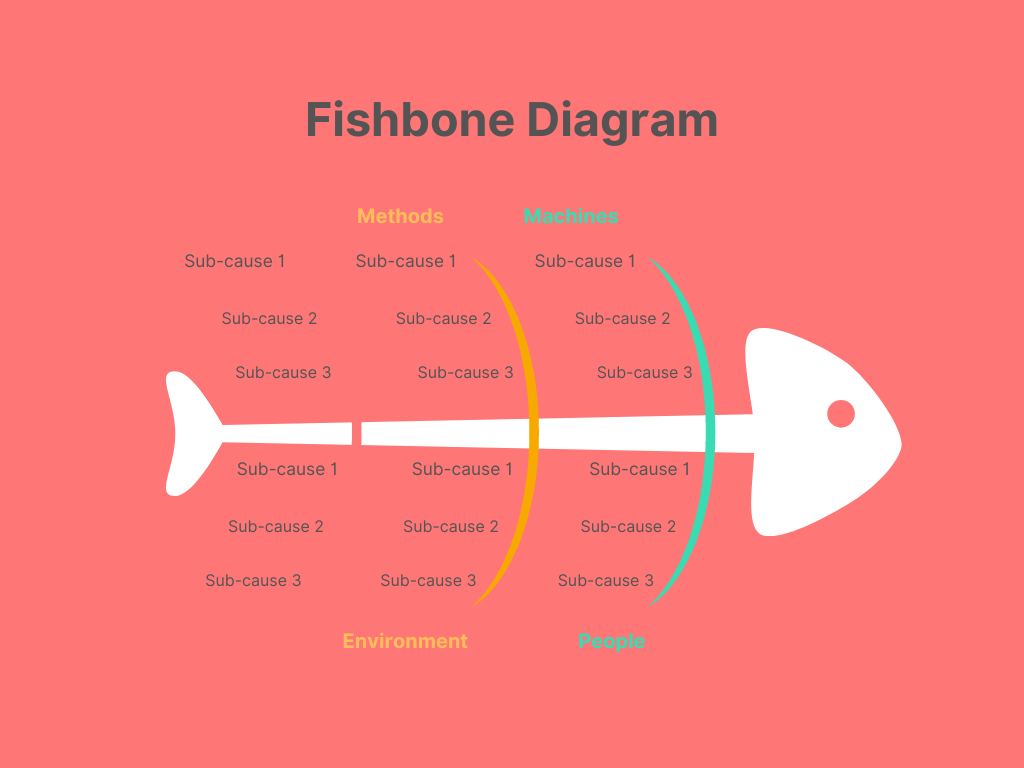
1. Cause and Effect Diagram (Fishbone Diagram)
The Cause and Effect Diagram, often called the Fishbone Diagram due to its shape, is a visual tool used to explore and categorise potential causes contributing to a specific problem or effect. It organises brainstormed ideas into major categories such as people, methods, materials, machines, environment, and management, among others. By visually mapping out cause-and-effect relationships, teams can identify root causes more effectively and prioritise corrective actions accordingly. This tool fosters structured problem-solving and facilitates a comprehensive understanding of complex issues by revealing interdependencies within processes.
2. Pareto Chart
The Pareto Chart is a bar graph that ranks issues or causes in descending order of frequency or impact. Named after Vilfredo Pareto, an economist who observed the 80/20 rule (where roughly 80% of effects come from 20% of causes), this tool helps prioritise efforts by focusing on the most significant factors contributing to a problem or outcome. By visually highlighting the "vital few" from the "trivial many," Pareto Charts enable teams to allocate resources efficiently and address high-impact issues first, maximising improvement efforts' effectiveness.
3. Histogram
A Histogram is a graphical representation of data distribution, displaying the frequency and variation of a process or phenomenon over time. It consists of bars representing the frequency of data points falling within predefined intervals or bins. Histograms provide insights into the shape, central tendency, and spread of data, aiding in identifying patterns, trends, and outliers. This tool is essential for analysing data distribution characteristics, detecting deviations from expected norms, and making informed decisions based on empirical evidence.
4. Control Chart
The Control Chart is a statistical tool that monitors process variation over time. It distinguishes between common cause variation (inherent to the process) and special cause variation (resulting from external factors or anomalies). Control Charts typically plot data points against predetermined control limits, including a central line representing the process mean or median. By visualising trends, shifts, and patterns in data, Control Charts enable practitioners to maintain process stability, detect deviations early, and take corrective action before defects occur. This proactive approach ensures consistent quality and performance within defined standards.
5. Scatter Diagram
A Scatter Diagram is a graphical tool that depicts the relationship between two variables. It consists of a series of data points plotted on a Cartesian plane, where each point represents the values of both variables. Scatter Diagrams help visualise correlations, trends, or patterns in data, indicating whether changes in one variable may influence another. This tool facilitates hypothesis testing, root cause analysis, and decision-making by providing insights into the strength and direction of relationships between variables, thereby guiding effective problem-solving and process optimization strategies.
6. Flow Chart
A Flow Chart is a visual representation of the sequence of steps in a process or workflow. It uses standardised symbols and connectors to depict activities, decision points, and interdependencies within a process. Flow Charts provide clarity and transparency by illustrating the flow of information, materials, or actions from start to finish. They facilitate process analysis, identification of inefficiencies or bottlenecks, and optimization of workflows by enabling stakeholders to visualise, understand, and communicate complex processes effectively. This tool is indispensable for enhancing operational transparency, consistency, and efficiency across organisational functions.
7. Check Sheet
A Check Sheet, or a Tally Sheet, is a simple form or template used for systematic data collection and recording. It typically consists of predefined categories or criteria that facilitate the counting or categorization of occurrences, defects, or observations. Check Sheets streamline data collection efforts, standardise recording procedures, and provide a structured format for aggregating quantitative data. By organising information clearly and concisely, Check Sheets support informed decision-making, trend analysis, and problem identification, making them valuable tools for process monitoring and improvement initiatives.
8. Stratification
Stratification is a method of sorting data into distinct layers or categories based on specific criteria such as time, location, or process stage. It divides data sets into meaningful subsets to facilitate targeted analysis and problem identification. Stratification allows practitioners to identify patterns, trends, or anomalies within each category, enabling more focused investigation and decision-making. By stratifying data, organisations gain deeper insights into underlying causes, variations, or performance issues, thereby enhancing the effectiveness of corrective actions and quality improvement efforts.
9. The 5 Whys
The 5 Whys is a technique for root cause analysis that involves asking "why" multiple times to delve deeper into the underlying reasons behind a problem or issue. By iteratively questioning the causes of a problem, teams can uncover successive layers of causality beyond immediate symptoms. The goal is to identify the fundamental root cause(s) rather than superficial explanations, enabling targeted interventions that effectively address the problem's source. The simplicity and effectiveness of the 5 Whys make it a powerful tool for problem-solving, continuous improvement, and preventing the recurrence of issues in processes or systems.
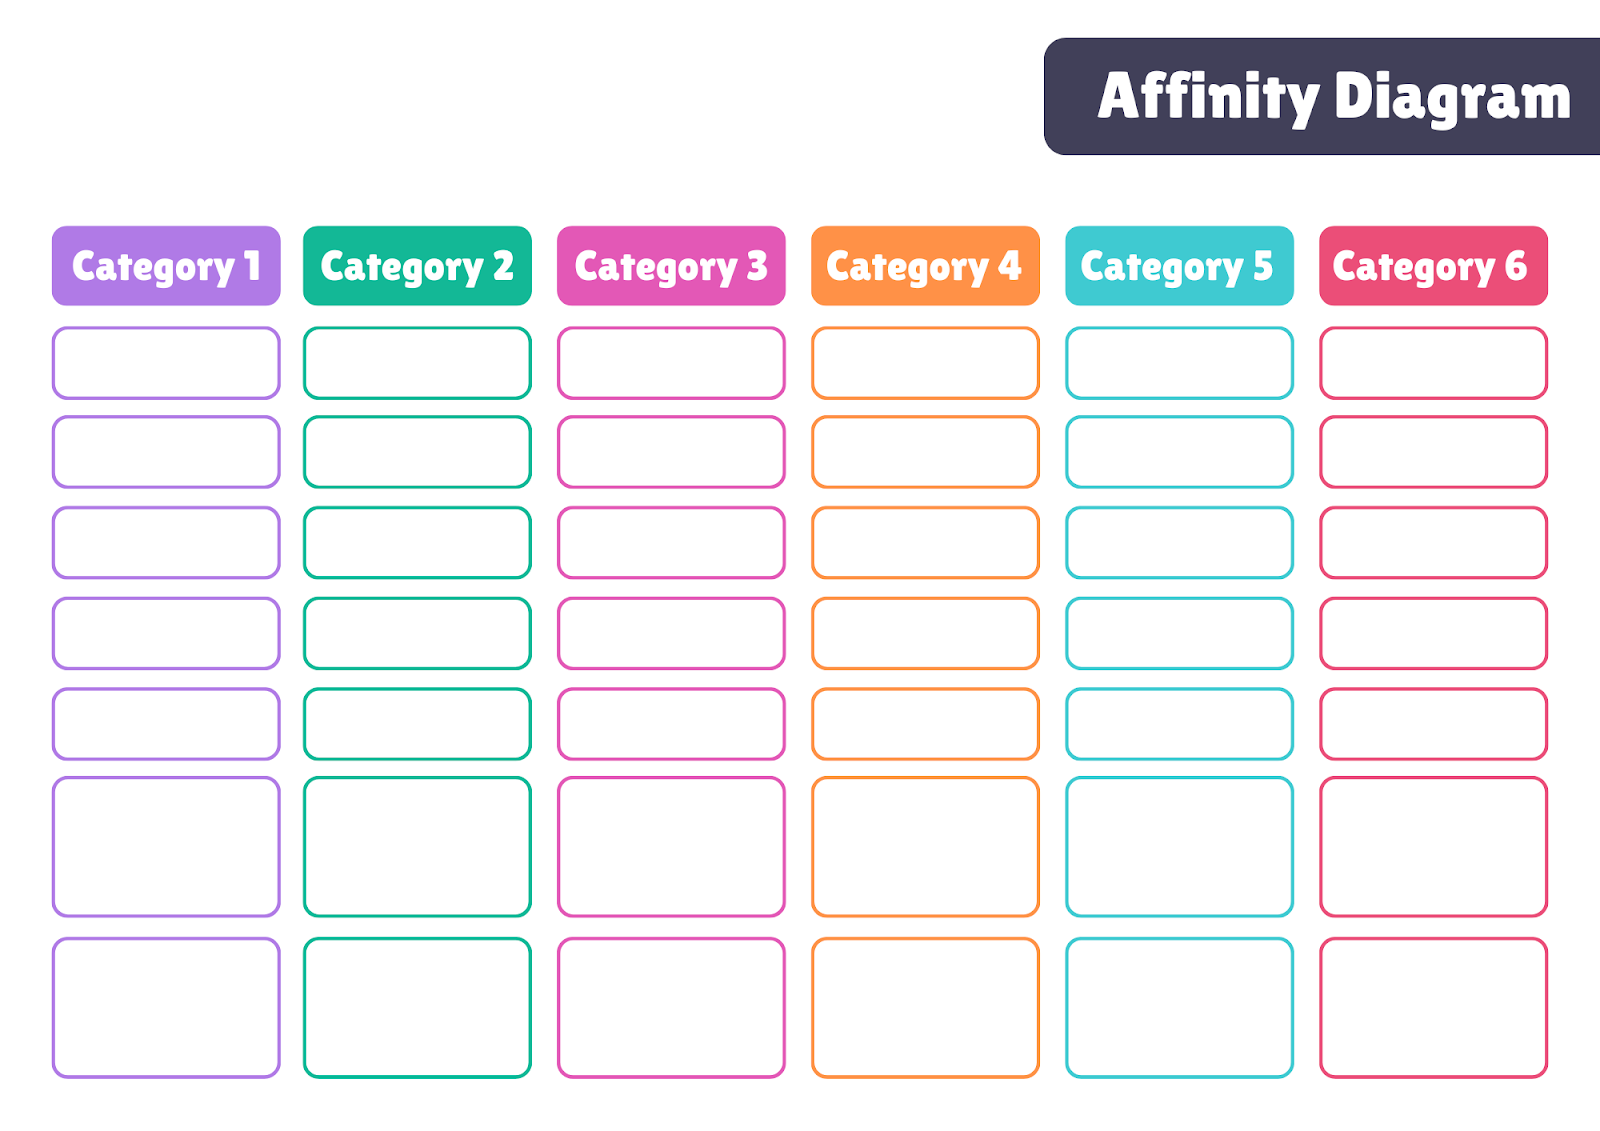
10. Affinity Diagram
An Affinity Diagram, also known as KJ Method or Affinity Chart, is a tool for organising and clustering ideas, issues, or information into meaningful categories based on their natural relationships or affinity. It encourages brainstorming and group collaboration by allowing participants to generate ideas, write them on cards or notes, and then group related ideas together based on common themes or patterns. Affinity Diagrams facilitate structured problem-solving, decision-making, and planning by visually organising complex information into logical groupings. This tool promotes consensus-building, creativity, and systematic analysis of qualitative data, making it invaluable for organising thoughts and identifying patterns of thought or action.
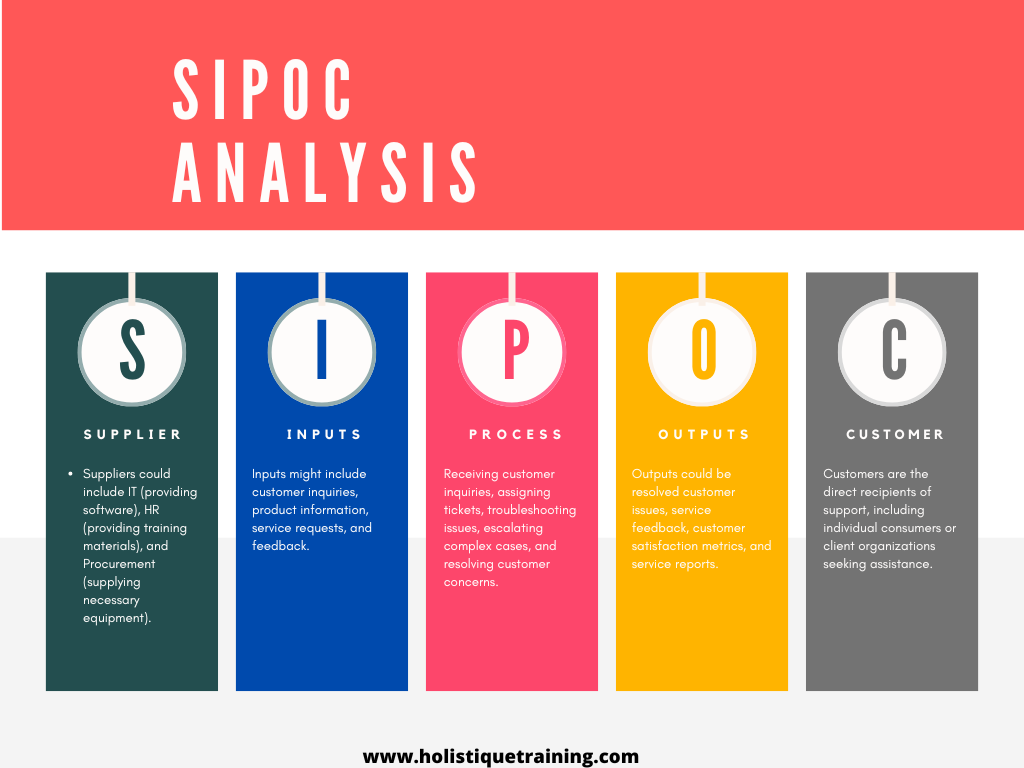
11. SIPOC Diagram
The SIPOC Diagram is an acronym representing Suppliers, Inputs, Processes, Outputs, and Customers. It provides a high-level overview of a process or system by identifying its key components and stakeholders. SIPOC Diagrams help stakeholders visualise the sequence of activities, dependencies, and interactions involved in delivering a product or service to customers. Organisations clarify process boundaries, critical interfaces, and customer requirements by mapping out these elements. SIPOC Diagrams facilitate communication, alignment, and continuous improvement efforts by ensuring that all stakeholders understand process objectives, roles, and responsibilities.
Scenario: Implementing a New Customer Service Process
Situation: A company is revamping its customer service process to enhance responsiveness and satisfaction levels. The project team must thoroughly understand the current process and identify key stakeholders and inputs before implementing changes.
Using the SIPOC Diagram:
In summary, the 11 Quality Tools serve as indispensable instruments for professionals committed to achieving excellence, driving continuous improvement, and delivering superior career outcomes. By mastering these tools and integrating them into daily practice, individuals and organisations can enhance problem-solving capabilities, optimise processes, and foster a culture of quality and innovation. Embrace these tools as catalysts for transformation and empowerment, guiding your journey towards sustained success and leadership in today's competitive landscape.
Quality Management and the Role of Quality Tools
Quality management encompasses the principles, methodologies, and practices to ensure products, services, and processes consistently meet or exceed customer expectations. Quality management fosters a commitment to continuous improvement, customer satisfaction, and operational excellence. Quality tools play a crucial role within this framework by providing structured approaches to problem-solving, data analysis, and process optimization. Their systematic application empowers organisations to achieve measurable quality, efficiency, and competitiveness improvements.
Enhancing Process Understanding and Optimisation
Quality tools serve as vital aids in understanding and optimising processes within organisations. Tools such as Flow Charts and SIPOC Diagrams enable stakeholders to visualise process workflows, dependencies, and interactions across functional areas. By documenting and analysing these processes, organisations can identify inefficiencies, streamline operations, and eliminate unnecessary steps or redundancies. This holistic view enhances transparency, accountability, and alignment with strategic objectives, facilitating continuous process improvement and operational excellence.
Facilitating Data-Driven Decision-Making
In today's data-driven landscape, informed decision-making is paramount to organisational success. Quality tools provide frameworks for collecting, analysing, and interpreting data effectively. For instance, Pareto Charts and Control Charts offer visual representations highlighting trends, patterns, and deviations in data, enabling stakeholders to prioritise actions based on empirical evidence. By making data accessible and actionable, these tools empower leaders to make informed decisions that drive performance improvement, mitigate risks, and capitalise on opportunities for innovation and growth.

Using an Excel spreadsheet has now become a necessity in most workplaces. You can use them to track your progress during projects, understand your performance metrics, or track your budget. Excel also creates graphs and charts to display your progress and plans to interested stakeholders
Driving Continuous Improvement Initiatives
Continuous improvement is a cornerstone of quality management, emphasising ongoing efforts to enhance processes, products, and services. Quality tools such as the 5 Whys and Cause and Effect Diagrams facilitate root cause analysis, enabling teams to identify underlying issues and implement targeted solutions. By systematically addressing the root causes of problems, organisations can prevent recurrence, optimise performance, and foster a culture of innovation and learning. This iterative approach to improvement ensures that organisations remain adaptable, responsive, and competitive in dynamic market environments.
Promoting Stakeholder Engagement and Collaboration
Effective quality management relies on active engagement and collaboration among stakeholders at all levels of the organisation. Quality tools such as Check Sheets and Affinity Diagrams encourage participation in data collection, analysis, and problem-solving activities. Organisations harness diverse perspectives, expertise, and insights by involving cross-functional teams in quality initiatives to drive consensus-driven decisions and solutions. This collaborative approach enhances problem-solving capabilities and fosters a sense of ownership, commitment, and accountability among team members towards achieving sharedquality objectives.
Supporting Compliance and Risk Management
Adherence to regulatory requirements and industry standards is critical for organisational integrity and sustainability. Quality tools are crucial in supporting compliance and risk management efforts by providing structured methodologies for documenting processes, tracking performance metrics, and conducting audits. Tools such as Histograms and Scatter Diagrams aid in analysing data variability and identifying potential risks or non-conformities. By proactively addressing compliance challenges and mitigating risks, organisations uphold operational excellence, build trust with stakeholders, and safeguard their reputation in the marketplace.
Driving Customer-Centric Quality Initiatives
Customer satisfaction is a cornerstone of quality management, emphasising the importance of meeting or exceeding customer expectations. Quality tools enable organisations to gather customer feedback, analyse preferences, and align products or services with customer needs. Tools such as Pareto Charts and Stratification facilitate prioritising customer requirements and improvement initiatives based on impact and significance. By delivering value and superior customer experiences, organisations enhance loyalty, retention, and advocacy, thereby gaining a competitive edge in the marketplace.
In short, quality management and quality tools are inseparable components of organisational excellence and sustainable growth. By integrating quality tools into quality management practices, organisations can enhance process efficiency, drivecontinuous improvement, mitigate risks, and deliver superior value to customers. Embrace these tools as catalysts for transformation and innovation, empowering your organisation to achieve and maintain leadership in today's competitive global landscape. As you incorporate these principles into your daily practice, you will enhance your professional capabilities and contribute to a culture of quality, collaboration, and continuous improvement within your organisation.
Tips for Using the Right Tools for Your Career
Effectively utilising quality tools can significantly enhance your ability to solve problems, improve processes, and achieve career success. Here are practical tips to help you leverage the right tools effectively in your professional journey:
1. Understand the Problem Contextually
Before selecting a quality tool, take time to understand the problem or opportunity for improvement thoroughly. Clarify the scope, objectives, and desired outcomes. This contextual understanding will guide you in choosing the most appropriate tool that aligns with the specific nature and complexity of the issue at hand.
2. Choose Appropriate Tools Based on Data Availability
Consider the type and availability of data relevant to your problem. Forquantitative data, tools such as Histograms, Control Charts, and Pareto Charts are ideal for visualising patterns, trends, and statistical insights.Qualitative data, on the other hand, may benefit from tools like Affinity Diagrams or the 5 Whys technique for organising ideas and exploring root causes, respectively.
3. Master the Techniques
Invest time in mastering the application of each quality tool. Familiarise yourself with each tool's principles, methodologies, and best practices. Practice using them in simulated or real-world scenarios to build proficiency and confidence in their application. Continuous learning and refining your skills will enhance your effectiveness in using these tools to drive meaningful improvements.
4. Collaborate and Seek Diverse Perspectives
Quality improvement is often a collaborative effort involving cross-functional teams and stakeholders. Engage collaboratively with colleagues, subject matter experts, and relevant stakeholders in using quality tools. By leveraging diverse perspectives and expertise, you can gain valuable insights, identify blind spots, and generate innovative solutions that comprehensively address multifaceted challenges.
5. Measure and Monitor Impact
Establish clear metrics and performance indicators to assess the impact of quality initiatives facilitated by these tools. Tools such as Control Charts can help monitor process stability and variation over time, while Check Sheets and Stratification enable systematic data collection and analysis. Regularly review performance metrics to track progress, identify areas for further improvement, and demonstrate the tangible benefits of using quality tools in achieving organisational goals.
Metric | Description | Importance |
Customer Satisfaction | Measure of customer contentment with services. | Indicates service effectiveness. |
Defect Rate | Frequency of defects in products or processes. | Reflects quality performance. |
Process Cycle Time | Duration to complete a process from start to finish. | Indicates operational efficiency. |
Cost of Quality | Expenses related to maintaining product/service quality. | Reflects cost-effectiveness. |
Employee Engagement | Level of employee commitment and involvement. | Affects productivity and quality culture. |
Table: Metrics to measure the impact of quality initiatives facilitated by quality tools
6. Communicate Effectively
Effective communication is essential when using quality tools to drive change and improvement. Clearly articulate findings, insights, and recommendations derived from applying these tools. Tailor your communication to resonate with different stakeholders, using visual aids such as charts, diagrams, and summaries to convey complex information succinctly and persuasively. Engage stakeholders in discussions to ensure alignment, gather feedback, and fosterbuy-in for implementing recommended improvements.
7. Embrace Lifelong Learning and Adaptation
Quality management practices and tools evolve with technological advancements and changing industry landscapes. Stay updated on emerging tools, methodologies, and industry best practices related to quality management. Embrace a mindset of continuous learning, experimentation, and adaptation to remain agile and responsive to evolving challenges and opportunities in your career.
By applying these tips, you can effectively harness the power of quality tools to drive continuous improvement, solve complex problems, and achieve career success. Embrace quality tools as instruments for enhancing operational efficiency and effectiveness and as catalysts for personal and professional growth. Integrating these tips into your daily practice will cultivate a reputation as a proactive problem-solver and valuable contributor to organisational excellence in your chosen field.
Conclusion
In conclusion, mastering the 11 Quality Tools and integrating them into your professional toolkit can significantly enhance your ability to drive quality improvements, solve complex problems, and achieve career success. By understanding their origins, principles, and applications within quality management, you can effectively contribute to organisational excellence and deliver superior outcomes in your chosen field. Embrace these tools as instruments of empowerment and transformation, guiding your journey towards continuous improvement and lasting success in the dynamic landscape of modern industries.
Incorporate these principles into your daily practice, and watch as your commitment to quality and efficiency propels you towards new heights of professional achievement and personal satisfaction. If you're eager to deepen your understanding and practical application of quality management strategies, consider enrolling in our comprehensive course on Quality Management Strategies. Explore advanced techniques, case studies, and practical insights designed to equip you with the skills needed to lead successful quality initiatives and drive organisational excellence. Take charge of your career growth and join us in mastering the tools that define industry leaders.

The best quality management strategies encompass a multifaceted approach aimed at consistently delivering superior products or services that meet or exceed customer expectations. At its core, these strategies emphasise a commitment to continuous improvement, fostering a culture of quality throughout the organisation. Adopting international standards