- Table of Contents
- Introduction
- What Is Cost Volume Profit (CVP) Analysis?
- Why Is CVP Important in Business Financial Planning?
- Difference between CVP Analysis and Break-Even Analysis
- Focus and Scope
- Calculation Method
- Usefulness in Decision Making
- Application in Strategic Planning
- Consideration of Assumptions
- What Is the Contribution Margin?
- Calculation of Contribution Margin
- Significance of Contribution Margin
- Contribution Margin vs. Gross Profit
- Business Risks of CVP Analysis
- Over-reliance on Assumptions
- Ignoring Market Conditions
- Fixed Costs Changes
- Linear Cost and Revenue Assumptions
- Exclusion of Qualitative Factors
- Short-term Focus
- Scenario Specificity
- How to Plot the CVP Graph
- Real-Life Example of CVP Analysis
- Company Overview
- Calculating the Contribution Margin
- Analysing Profit at Different Sales Levels
- Practical Applications of CVP Analysis
- In Conclusion
Introduction
Every business, regardless of its size or industry, operates with the fundamental goal of generating profit. Achieving this goal requires meticulous planning and a deep understanding of various financial concepts, one of which is Cost Volume Profit (CVP) Analysis. CVP analysis is a powerful tool that helps businesses understand how changes in costs and volume affect their operating profit. This comprehensive guide will delve into the intricacies of CVP analysis, its significance in financial planning, and its practical application in real-world scenarios.
What Is Cost Volume Profit (CVP) Analysis?
Cost Volume Profit (CVP) analysis is a method used by businesses to determine how changes in costs and sales volume impact profit. It involves the relationship between five key components: sales price, sales volume, variable costs per unit, total fixed costs, and profit. By analysing these elements, businesses can make informed decisions about pricing, production levels, and product mix to achieve their financial goals.
The basic formula for CVP analysis is:
Profit=(Sales Price×Units Sold)−(Variable Cost per Unit×Units Sold)−Total Fixed Costs
Profit=(Sales Price×Units Sold)−(Variable Cost per Unit×Units Sold)−Total Fixed Costs
Breaking down the formula:
- Sales Price: The amount charged to customers for each unit of product sold.
- Units Sold: The quantity of products sold.
- Variable Cost per Unit: Costs, such as raw materials and direct labour, vary directly with the production volume.
- Total Fixed Costs remain constant regardless of the production volume, such as rent, salaries, and insurance.

Master cost analysis for smarter planning: explore types, tech tools, and steps to boost financial precision, resilience, and resource efficiency.
Why Is CVP Important in Business Financial Planning?
Cost Volume Profit (CVP) analysis is a cornerstone of business financial planning, offering crucial insights that help managers and entrepreneurs navigate the complex landscape of costs, sales, and profits. Its importance in business financial planning cannot be overstated, as it provides a clear framework for making informed strategic decisions. Here are several reasons why CVP analysis is indispensable:
Decision Making
One of the primary benefits of CVP analysis is its role in enhancing decision-making processes. Managers can make more informed choices about pricing, production levels, and product lines by understanding the intricate relationships between cost, volume, and profit. For example, if a business is considering a price reduction to increase sales volume, CVP analysis can help determine whether the increase in volume will offset the lower margin per unit. This enables managers to choose strategies that maximise profitability rather than relying on intuition or incomplete data.
Profit Planning
Profit planning is a critical aspect of any business, and CVP analysis provides a systematic approach to setting profit targets and determining the necessary sales volume to achieve these targets. Businesses can set realistic and achievable financial goals by calculating the break-even point and analysing the impact of different sales volumes on profitability. This is particularly useful for startups and businesses planning expansions, providing a clear roadmap for achieving financial stability and growth.
Cost Control
Effective cost control is vital for maintaining profitability, and CVP analysis offers valuable insights into both fixed and variable costs. By breaking down costs into these categories, businesses can identify areas where cost reductions can be made without compromising product quality or customer satisfaction. For instance, if variable costs are high, a company might look for more cost-effective suppliers or improve operational efficiencies to reduce these costs. On the other hand, understanding fixed costs helps make long-term investment decisions, such as whether to lease or buy equipment.
Budgeting
CVP analysis plays a crucial role in the budgeting process. Businesses can develop more accurate and realistic budgets by clearly showing how different activity levels affect costs and revenues. This ensures that resources are allocated efficiently and financial targets are met. For example, if a company knows its fixed costs and contribution margin, it can forecast the required sales volume to meet its budgeted profit, aligning operational activities with financial goals.
Risk Management
In an ever-changing business environment, risk management is essential. CVP analysis allows businesses to assess the impact of various changes in market conditions—such as price fluctuations, changes in consumer demand, and competitive actions—on their profitability. By performing sensitivity analysis, which involves changing one variable at a time (like sales price or volume) and observing the effect on profit, businesses can identify potential risks and develop contingency plans. This proactive approach to risk management helps in mitigating potential financial setbacks.

Developing a successful and profitable business requires a wide array of financial understanding to create a cost-effective roadmap for future developments, forecasting, and change. Risk management goes hand in hand with financial planning, as a foolproof framework will allow you to make sound, strategic decisions
Product Line Analysis
For companies with multiple products, CVP analysis can help determine the profitability of each product line. By analysing the contribution margin of each product, businesses can decide which products to promote, modify, or discontinue. This ensures that resources are focused on the most profitable products, optimising the overall product mix and enhancing the company’s profitability. For example, if one product has a significantly higher contribution margin than others, the company might choose to allocate more marketing resources to that product.
Strategic Planning
Long-term strategic planning is another area where CVP analysis proves invaluable. By providing insights into how different strategic decisions (like entering new markets, launching new products, or changing the production process) will affect costs and profits, CVP analysis helps businesses develop and implement effective strategies. This ensures that strategic initiatives are financially viable and aligned with the company’s goals. For instance, if a business is considering an expansion, CVP analysis can help forecast the additional costs and required sales volume to ensure the expansion is profitable.
Performance Evaluation
CVP analysis is also useful for evaluating business performance. By comparing actual results with CVP projections, businesses can assess whether they are on track to meet their financial targets. This helps identify deviations and promptly take corrective actions. For example, if actual sales are lower than projected, a company can investigate the reasons behind this shortfall and implement strategies to boost sales, such as marketing campaigns or sales promotions.
Scenario Planning
In addition to its use in current financial planning, CVP analysis is a powerful tool for scenario planning. Businesses can create various "what-if" scenarios to understand how different strategies or external factors will impact their financial outcomes. This helps prepare for future uncertainties and makes more resilient business plans. For instance, a company might use CVP analysis to model the impact of a 10% increase in raw material costs or a 15% decrease in sales volume due to market downturns, enabling them to plan accordingly.
In summary, CVP analysis is a multifaceted tool supporting various business financial planning aspects. CVP analysis empowers businesses to make informed decisions, optimise operations, and achieve their financial objectives by offering insights into cost behaviours, profitability, and the financial implications of different strategic choices. Whether for daily operational decisions, long-term strategic planning, or risk management, the insights from CVP analysis are invaluable for steering a business towards sustained profitability and growth.

Most business or project plans fail within the first few months. For this reason, it’s essential that you plan out the project framework, consider costs, benefits, and requirements for each stage alongside equipment and resources, and come to an accurate conclusion regarding whether your project
Difference between CVP Analysis and Break-Even Analysis
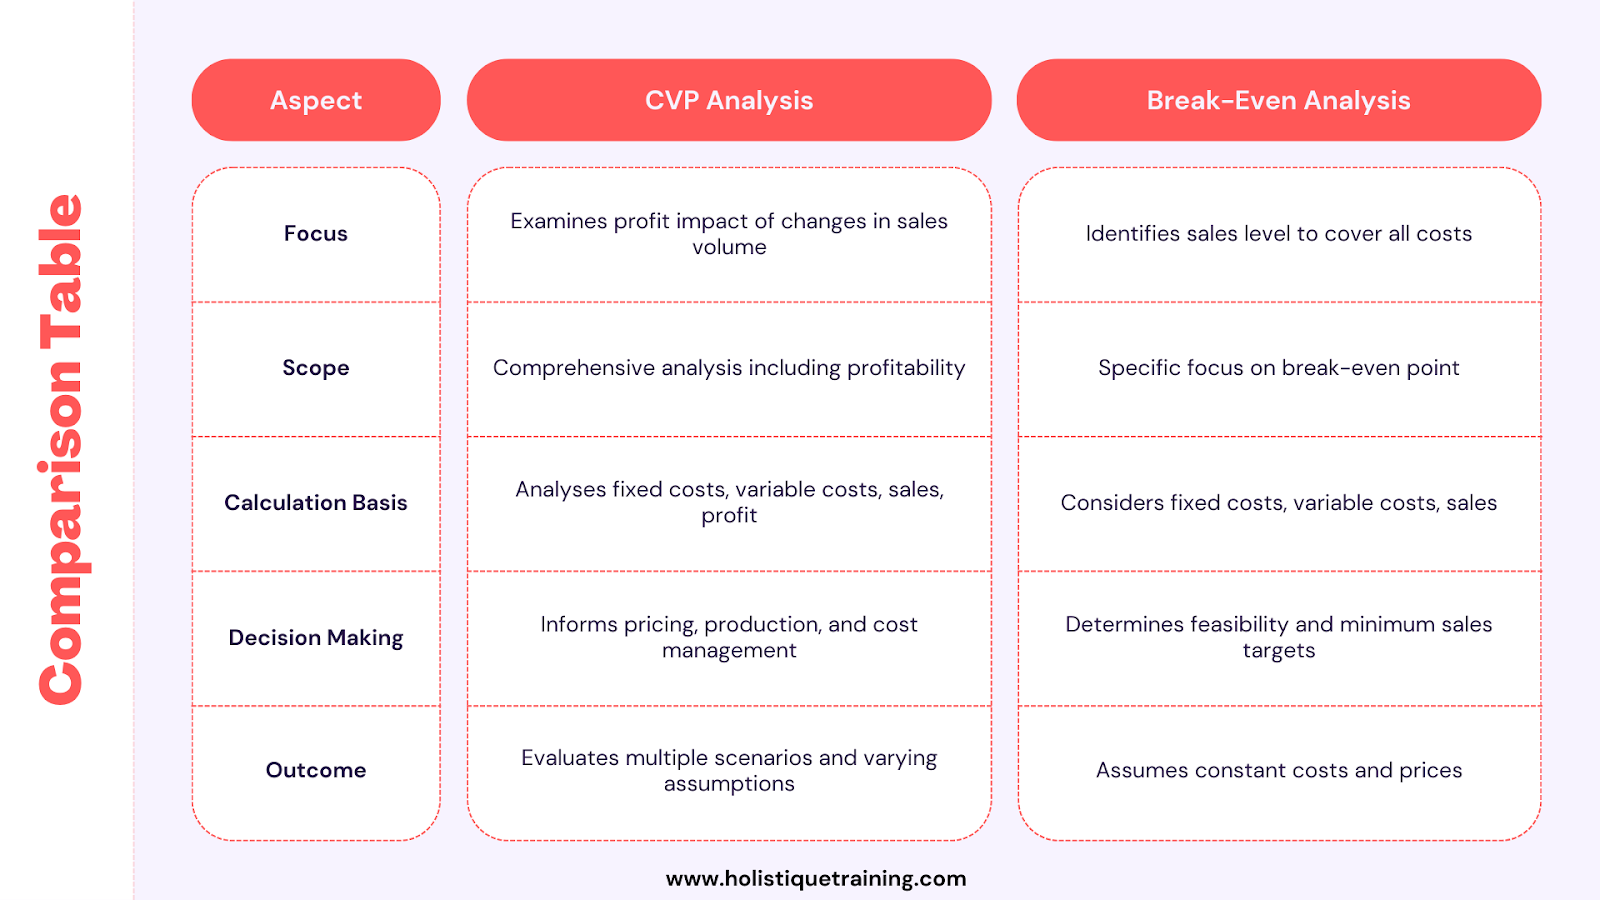
Cost Volume Profit (CVP) analysis and break-even analysis are valuable tools in financial management, providing insights into a company's profitability and the relationship between costs, sales volume, and revenue. While they are related concepts and often used together, they serve distinct purposes and offer different perspectives on the financial health of a business. Understanding the differences between CVP analysis and break-even analysis is essential for leveraging them effectively in decision-making processes.
Focus and Scope
Break-Even Analysis: Break-even analysis identifies the point at which total revenue equals total costs, resulting in neither profit nor loss. It provides a snapshot of a business's financial position at a single sales volume level, indicating the minimum level of sales required to cover all costs.
CVP Analysis: CVP analysis, on the other hand, is more comprehensive. It examines how changes in sales volume affect profit. It considers not only the break-even point but also the impact of different sales volumes on profitability, considering variable costs, fixed costs, sales prices, and sales volume.
Calculation Method
Break-Even Analysis: Break-even analysis typically involves calculating the break-even point in units or dollars. The break-even point in units represents the number of units a company must sell to cover its total fixed and variable costs, while the break-even point in dollars represents the level of sales revenue needed to achieve this balance.
CVP Analysis: CVP analysis extends beyond the break-even point to assess the relationship between sales volume and profit. It involves calculating contribution margin and the difference between sales revenue and variable costs per unit. It is also used to analyse profitability at various sales levels.
Usefulness in Decision Making
Break-Even Analysis: Break-even analysis is useful for assessing the feasibility of a business venture, pricing strategies, and determining the level of sales needed to cover costs. It provides a straightforward measure of financial viability and helps set sales targets and pricing products.
CVP Analysis: CVP analysis offers a deeper understanding of how changes in sales volume, costs, and prices impact profit. It helps make more informed decisions about pricing, production levels, product mix , and cost control strategies. CVP analysis is particularly valuable for strategic planning and evaluating the financial implications of different business scenarios.
Application in Strategic Planning
Break-Even Analysis: Break-even analysis is often used as a starting point in strategic planning, providing a baseline for assessing the financial impact of various decisions. It helps evaluate the risk associated with different business initiatives and determine the level of sales needed to achieve desired profit levels.
CVP Analysis: CVP analysis provides a more nuanced view of a company's financial performance and helps develop comprehensive strategic plans. By analysing the contribution margin and understanding the relationship between costs, volume, and profit, businesses can make informed decisions about resource allocation, expansion plans, and long-term growth strategies.
Consideration of Assumptions
Break-Even Analysis: Break-even analysis simplifies assumptions like constant sales prices and linear cost behaviours. While these assumptions make calculations easier, they may not accurately reflect real-world complexities.
CVP Analysis: CVP analysis also makes assumptions about cost and revenue behaviours but offers more flexibility in considering different scenarios and variables. It allows businesses to perform sensitivity analysis and assess the impact of changes in market conditions, pricing strategies, and cost structures on profitability.
In short, while CVP and break-even analyses provide valuable insights into a company's financial performance, they offer different purposes and distinct perspectives. Break-even analysis identifies the point at which total revenue equals total costs, providing a baseline for financial decision-making. CVP analysis, on the other hand, examines how changes in sales volume affect profit, offering a more comprehensive understanding of profitability and guiding strategic planning efforts. By leveraging both tools effectively, businesses can make informed decisions, optimise performance, and achieve their financial objectives.
What Is the Contribution Margin?
Contribution margin is a vital financial metric crucial in Cost Volume Profit (CVP) analysis and managerial decision-making. It represents the revenue remaining after deducting variable costs and directly contributes to covering fixed costs and generating profit. Understanding contribution margin is essential for businesses to assess the profitability of products, make pricing decisions, and optimise their overall financial performance.
Calculation of Contribution Margin
The contribution margin is calculated by subtracting variable costs per unit from the sales price per unit. The resulting amount represents the revenue available to cover fixed costs and contribute to profit for each unit sold. The formula for calculating the contribution margin per unit is:
Contribution Margin per Unit=Sales Price per Unit−Variable Cost per Unit
Contribution Margin per Unit=Sales Price per Unit−Variable Cost per Unit
For example, if a company sells a product for $50 and incurs variable costs of $30 per unit, the contribution margin per unit would be:
Contribution Margin per Unit=$50−$30=$20
Contribution Margin per Unit=$50−$30=$20
This means that for each unit sold, $20 contributes to covering fixed costs and generating profit.
Significance of Contribution Margin
Contribution margin provides valuable insights into the financial performance of products and helps businesses make informed decisions in several key areas:
- Product Profitability: By calculating the contribution margin for each product, businesses can identify which products are the most profitable. Products with higher contribution margins contribute more to covering fixed costs and generating profit, while those with lower margins may require closer scrutiny or strategic adjustments.
- Pricing Decisions: Contribution margin analysis informs pricing decisions by helping businesses understand the impact of pricing changes on profitability. Companies can determine the optimal pricing strategy to maximise profitability without sacrificing sales volume by comparing contribution margins at different price points.
- Cost-Volume-Profit Analysis: Contribution margin is a central component of CVP analysis, which examines how changes in sales volume affect profit. By analysing the contribution margin ratio (contribution margin per unit divided by sales price per unit), businesses can assess the impact of changes in sales volume on overall profitability.
- Break-Even Analysis: The contribution margin calculates the break-even point, which represents the level of sales at which total revenue equals total costs. Businesses can determine the units or sales revenue needed to break even by dividing total fixed costs by the contribution margin per unit.
- Decision-Making: Contribution margin provides managers with a clear understanding of the incremental profitability of each unit sold. This information enables them to make informed decisions about resource allocation, production levels, product mix, and other strategic initiatives.
Contribution Margin vs. Gross Profit
It's essential to distinguish between contribution margin and gross profit, as they represent different aspects of a company's financial performance:
- Contribution Margin: This margin focuses on the revenue remaining after deducting variable costs and directly contributes to covering fixed costs and generating profit. It provides insights into the incremental profitability of each unit sold.
- Gross Profit:represents the revenue remaining after deducting the cost of goods sold (COGS), including variable and fixed manufacturing costs. While gross profit measures the profitability of products or services, it does not consider fixed costs, making it less useful for decision-making in the context of CVP analysis.
Contribution margin is a critical financial metric that provides valuable insights into product profitability, pricing decisions, and overall financial performance. By understanding product contribution margins, businesses can make informed decisions to optimise profitability, manage costs, and achieve financial objectives. Whether used in cost-volume-profit analysis, pricing strategies, or break-even analysis, contribution margin is a powerful tool for guiding managerial decision-making and strategic planning.
Business Risks of CVP Analysis
While Cost Volume Profit (CVP) analysis is a powerful tool for understanding the financial dynamics of a business, it is not without its risks. Several inherent limitations and potential pitfalls can affect the accuracy and reliability of CVP analysis, potentially leading to misguided decisions. Here, we delve into the key business risks associated with CVP analysis.
Over-reliance on Assumptions
CVP analysis is based on several critical assumptions that may not hold true in real-world scenarios. These assumptions include constant sales prices, stable variable costs per unit, and fixed costs that do not change with production levels. Over-reliance on these assumptions can lead to inaccurate analysis and misguided strategic decisions. For example:
- Constant Sales Prices: CVP analysis assumes that the sales price per unit remains constant regardless of the sales volume. However, in competitive markets, businesses often adjust prices due to changes in demand, competition, or cost of goods sold. If prices fluctuate, the results of the CVP analysis will not accurately reflect reality.
- Stable Variable Costs: The assumption that variable costs per unit are stable can be problematic. Variable costs can change due to economies of scale, changes in supplier prices, or fluctuations in the cost of raw materials. For instance, bulk purchasing might lower the per-unit cost, whereas supply chain disruptions might increase it.
- Fixed Fixed Costs: Fixed costs are assumed to remain constant within the relevant range of production. However, significant changes in production levels or business expansions can alter fixed costs. For example, expanding to a new facility increases rent and utilities, which are fixed costs.
Ignoring Market Conditions
CVP analysis typically focuses on internal financial data and may not adequately account for external market conditions. Market dynamics, such as consumer preferences, economic trends, and competitive actions, can significantly impact sales volumes and costs. Ignoring these factors can lead to an incomplete analysis. For example:
- Consumer Preferences: Shifts in consumer preferences can affect product demand, impacting sales volume and profitability. CVP analysis that does not consider these changes might misestimate the required production levels.
- Economic Trends: Economic conditions such as inflation, recession, or currency fluctuations can influence costs and sales prices. A CVP analysis that overlooks these trends might provide a skewed profitability picture.
- Competitive Actions: Actions by competitors, such as price cuts, new product introductions, or enhanced marketing efforts, can affect a company's market share and sales volume. CVP analysis that does not consider competitive actions might overestimate potential profits.
Fixed Costs Changes
In practice, fixed costs can change, especially with significant changes in business operations. For instance, scaling production might necessitate additional facilities or equipment, increasing fixed costs. Conversely, downsizing could reduce fixed costs. CVP analysis assumes fixed costs remain constant within a relevant range, which may not be accurate in scenarios involving substantial operational changes.
Linear Cost and Revenue Assumptions
CVP analysis assumes a linear relationship between costs, volume, and revenue. This simplification can lead to inaccuracies since real-world cost and revenue behaviours are often nonlinear. For example:
- Variable Costs: Variable costs might not increase proportionally with volume. Businesses might experience diminishing returns at higher production levels due to increased labour costs or inefficiencies.
- Revenue: Sales revenue might not grow linearly with sales volume. Bulk sales discounts, changes in sales mix, or market saturation can result in nonlinear revenue growth.
Exclusion of Qualitative Factors
CVP analysis primarily focuses on quantitative data, potentially overlooking qualitative factors that can influence business performance. These factors include brand reputation, customer satisfaction, employee morale, and market positioning. Ignoring these elements can lead to incomplete strategic planning. For instance:
- Brand Reputation: A strong brand can command premium pricing and customer loyalty, impacting sales volume and profitability. CVP analysis that neglects brand strength might underestimate the potential for higher sales prices.
- Customer Satisfaction: High customer satisfaction can lead to repeat business and positive word-of-mouth, driving sales growth. Failing to consider customer satisfaction levels might result in inaccurate sales volume forecasts.
- Employee Morale: Employee satisfaction and productivity can influence operational efficiency and costs. Overlooking employee morale might lead to unexpected increases in variable costs or declines in production quality.
Short-term Focus
CVP analysis is often used for short-term decision-making and may not adequately address long-term strategic considerations. Businesses that rely heavily on CVP analysis might focus on immediate profitability at the expense of long-term sustainability. For example:
- Investment in Innovation: Short-term CVP analysis might discourage investment in innovation or new product development if the immediate costs are high, potentially sacrificing long-term competitive advantage.
- Sustainability Initiatives: Initiatives aimed at sustainability might increase costs in the short term but lead to long-term benefits such as enhanced brand reputation and regulatory compliance. CVP analysis focused on short-term outcomes might undervalue these initiatives.
Scenario Specificity
CVP analysis is typically based on specific scenarios and assumptions that might not generalise across business contexts or market conditions. This specificity can limit the applicability of CVP results. For instance:
- Market Segments: Different market segments might exhibit distinct cost behaviours and sales dynamics. A CVP analysis based on one segment might not apply to another.
- Geographic Variations: Costs and revenue potential can vary significantly across geographic regions. CVP analysis that does not account for geographic differences might lead to incorrect conclusions about profitability.
In summary, while CVP analysis is a valuable tool for understanding cost behaviours and making informed financial decisions, it is important to know its limitations and risks. Over-reliance on assumptions, ignoring market conditions, changes in fixed costs, linear cost and revenue assumptions, exclusion of qualitative factors, short-term focus, and scenario specificity can all impact the accuracy and reliability of CVP analysis. Businesses should use CVP analysis as one of several tools in their financial planning toolkit, complementing it with other analytical methods and considering quantitative and qualitative factors to make well-rounded strategic decisions. By understanding and mitigating these risks, businesses can more effectively leverage CVP analysis to drive profitability and growth.

Within any business, your finances are key in aiding growth, maintaining good products and services, and keeping employees happy. Your ability to plan strategically within a set budget allows you to keep generating profit to develop further but also gives a good indication to any
How to Plot the CVP Graph
A CVP graph visually represents the relationships between costs, volume, and profit. To plot a CVP graph, follow these steps:
- Determine the Range of Units: Decide on the range of units to be analysed (e.g., 0 to 1,000 units).
- Calculate Total Costs and Revenues: For each unit level within the range, calculate the total fixed costs, total variable costs, and total revenue.
- Plot the Fixed Costs Line: Draw a horizontal line representing total fixed costs, as these remain constant regardless of the production volume.
- Plot the Total Costs Line: Add the variable costs to the fixed costs for each unit level and plot this as the total costs line.
- Plot the Total Revenue Line: Calculate the total revenue for each unit level and plot this line.
- Identify the Break-Even Point: The break-even point is where the total revenue line intersects the total costs line.
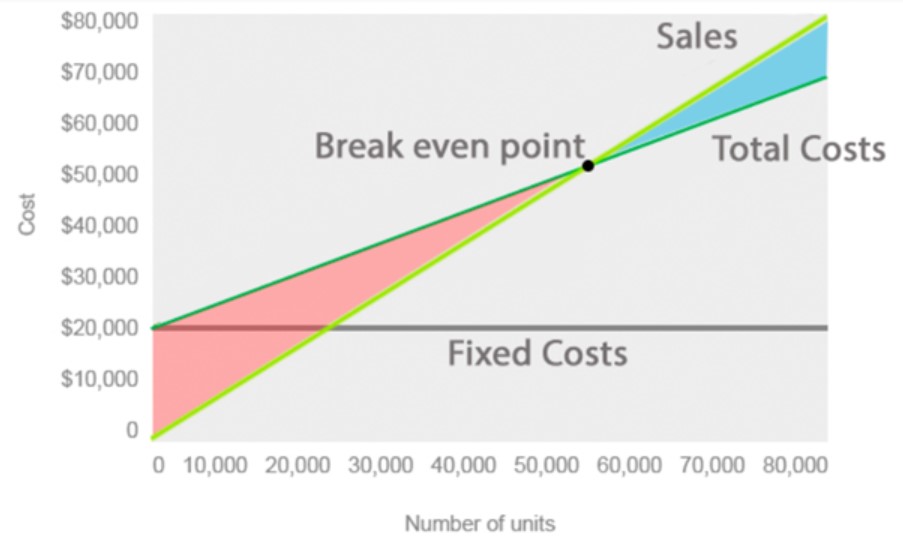
Source: Datarails
Real-Life Example of CVP Analysis
To illustrate the practical application of Cost Volume Profit (CVP) analysis, let's consider a hypothetical company, XYZ Widgets, which manufactures and sells widgets. This example will demonstrate how XYZ Widgets uses CVP analysis to make informed business decisions, such as setting sales targets, pricing strategies, and understanding profitability.
Company Overview
XYZ Widgets produces a single product, a widget, and has the following financial information:
- Sales Price per Widget: $50
- Variable Cost per Widget: $30
- Total Fixed Costs: $20,000
Using this data, we can perform a CVP analysis to understand the impact of different sales volumes on the company's profit. The key steps in this analysis include calculating the contribution margin, determining the break-even point, and analysing the profit at various sales levels.
Calculating the Contribution Margin
The contribution margin is the amount remaining from sales revenue after variable expenses have been deducted. It helps cover fixed costs and generate profit.
Contribution Margin per Unit = Sales Price per Unit−Variable Cost per Unit
Contribution Margin per Unit = Sales Price per Unit−Variable Cost per Unit
For XYZ Widgets:
Contribution Margin per Unit= $50−$30 = $20
Contribution Margin per Unit= $50−$30 = $20
The contribution margin per unit is $20, meaning that for each widget sold, $20 is available to cover fixed costs and contribute to profit.
Break-Even Point in Dollars:
Break-Even Point (in dollars)=Break-Even Point (in units)×Sales Price per Unit
Break-Even Point (in dollars)= Break-Even Point (in units)×Sales Price per Unit
For XYZ Widgets:
Break-Even Point (in dollars)=1,000 units×$50=$50,000
Break-Even Point (in dollars)=1,000 units×$50=$50,000
This indicates that XYZ Widgets needs $50,000 in sales revenue to cover all its costs.
Analysing Profit at Different Sales Levels
To understand how changes in sales volume impact profit, we can create a table showing total revenue, total costs, and profit at various sales levels.
Units Sold | Total Revenue ($) | Total Variable Costs ($) | Total Fixed Costs ($) | Total Costs ($) | Profit ($) |
800 | 40,000 | 24,000 | 20,000 | 44,000 | -4,000 |
1,000 | 50,000 | 30,000 | 20,000 | 50,000 | 0 |
1,200 | 60,000 | 36,000 | 20,000 | 56,000 | 4,000 |
1,400 | 70,000 | 42,000 | 20,000 | 62,000 | 8,000 |
1,600 | 80,000 | 48,000 | 20,000 | 68,000 | 12,000 |
This table highlights the financial outcomes at different sales volumes
- 800 Units Sold: Total revenue is $40,000, total variable costs are $24,000, and total costs (fixed + variable) are $44,000, resulting in a loss of $4,000.
- 1,000 Units Sold: Total revenue is $50,000, total variable costs are $30,000, and total costs are $50,000, resulting in zero profit (break-even point).
- 1,200 Units Sold: Total revenue is $60,000, total variable costs are $36,000, and total costs are $56,000, resulting in a profit of $4,000.
- 1,400 Units Sold: Total revenue is $70,000, total variable costs are $42,000, and total costs are $62,000, resulting in a profit of $8,000.
- 1,600 Units Sold: Total revenue is $80,000, total variable costs are $48,000, and total costs are $68,000, resulting in a profit of $12,000.
Practical Applications of CVP Analysis
- Setting Sales Targets: Using CVP analysis, XYZ Widgets can set realistic sales targets to achieve desired profit levels. For instance, to achieve a profit of $10,000, they can use the following formula:
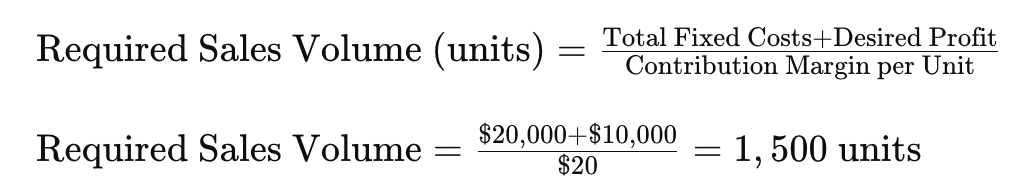
This calculation shows that XYZ Widgets must sell 1,500 units to earn a $10,000 profit.
2. Pricing Strategies: CVP analysis helps evaluate the impact of different pricing strategies. If XYZ Widgets considers lowering the sales price to increase volume, they can assess whether the increased sales volume will compensate for the reduced margin per unit. For example, if the price is reduced to $45 and they estimate selling 1,300 units:
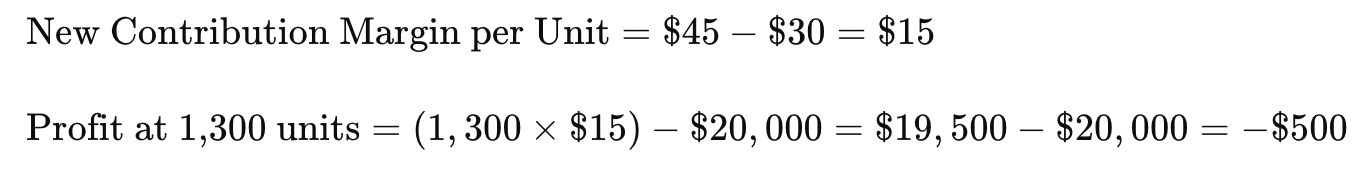
The analysis shows a loss, indicating that reducing the price to $45 would not be beneficial unless the sales volume increases significantly.
3. Assessing Impact of Cost Changes: CVP analysis can evaluate the effects of changes in variable costs on profitability. If the cost of raw materials increases, raising the variable cost per unit to $35:
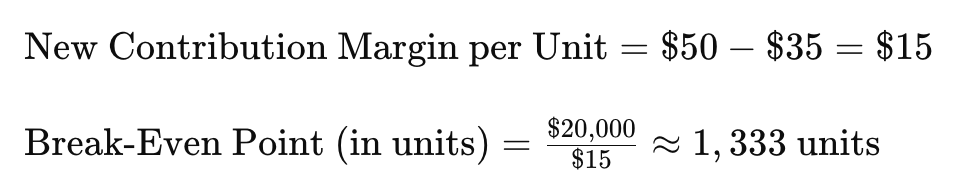
This new break-even point indicates that XYZ Widgets must sell approximately 1,333 units to cover the increased costs, emphasising the importance of managing variable costs effectively.
4. Product Line Decisions: If XYZ Widgets plans to introduce a new product with different cost structures, CVP analysis can help compare the profitability of the new product against existing products. This aids in deciding whether to proceed with the new product launch.
5. Budgeting and Forecasting: CVP analysis assists in creating budgets and financial forecasts by clearly understanding the relationship between sales volume, costs, and profit. This helps set realistic financial goals and align operational activities to achieve these targets.
Through the example of XYZ Widgets, we see how CVP analysis can be used to make informed business decisions about pricing, production, cost control, and profitability. Businesses can gain valuable insights into their financial operations by calculating the contribution margin, determining the break-even point, and analysing different sales volumes. CVP analysis helps set realistic sales targets, evaluate pricing strategies, manage costs, make product line decisions, and create accurate budgets. This systematic approach to understanding the interplay between costs, volume, and profit is essential for any business aiming to achieve financial success and sustainable growth.
In Conclusion
Cost Volume Profit (CVP) analysis is an essential tool for businesses aiming to understand the financial dynamics of their operations. By analysing the relationships between costs, sales volume, and profit, companies can make informed strategic decisions to enhance profitability and manage risks. While CVP analysis has limitations and potential risks, its benefits in financial planning, cost control, and decision-making make it a valuable asset for any business. Through real-life applications and careful consideration of its assumptions, CVP analysis can provide actionable insights to drive business success.
Enroll in our "Strategic Decision-Making Using Advanced Cost Analysis" course to enhance your expertise in this critical area. You will gain the skills and knowledge needed to use advanced cost analysis techniques for more effective strategic planning and decision-making.